## Grid Transformation Diagram: Input to Output Mapping
### Overview
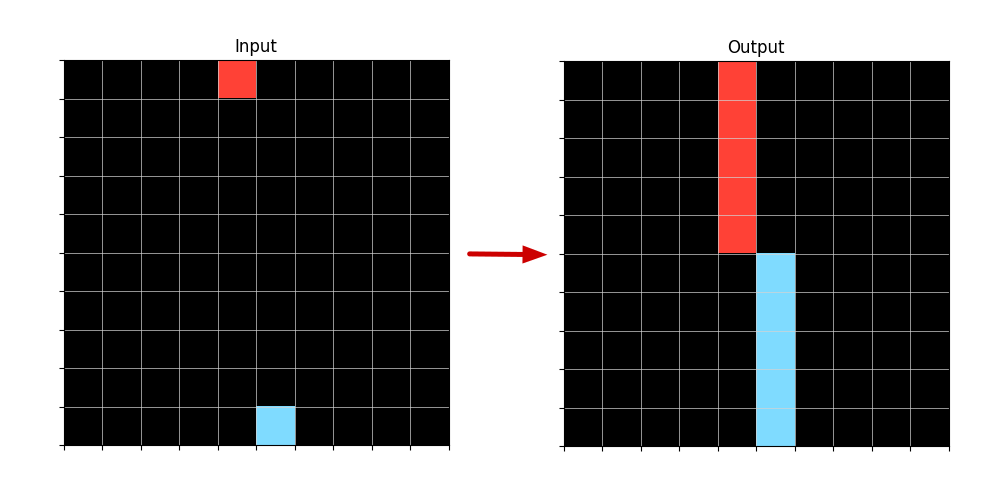
The image depicts a two-stage grid transformation process. A 10x10 grid labeled "Input" on the left contains two colored squares, which are transformed into vertical columns in a second 10x10 grid labeled "Output" on the right. A red arrow indicates the directional flow between the grids.
### Components/Axes
- **Grid Structure**:
- Both grids use a Cartesian coordinate system with axes labeled 1-10 on both X (horizontal) and Y (vertical) dimensions.
- Input grid:
- Red square at (X=3, Y=10)
- Blue square at (X=10, Y=3)
- Output grid:
- Red vertical column spanning Y=1 to Y=5 at X=3
- Blue vertical column spanning Y=1 to Y=5 at X=10
- **Directional Indicator**:
- Red arrow connects Input grid to Output grid, positioned centrally between the two grids.
### Detailed Analysis
1. **Input Grid**:
- Two discrete data points:
- Red square: (3,10) - located in the top row, third column
- Blue square: (10,3) - located in the third row, rightmost column
- Spatial relationship: Points form a diagonal pattern from top-left to bottom-right.
2. **Output Grid**:
- Two vertical columns:
- Red column: X=3, Y=1-5 (height = 5 units)
- Blue column: X=10, Y=1-5 (height = 5 units)
- Spatial relationship: Columns maintain horizontal alignment with their Input counterparts but are vertically compressed.
3. **Transformation Pattern**:
- Horizontal position preserved (X-coordinate remains unchanged)
- Vertical position inverted and scaled:
- Input Y=10 → Output Y=1-5 (top position becomes base of column)
- Input Y=3 → Output Y=1-5 (middle position becomes base of column)
- Magnitude scaling: Single unit input becomes 5-unit output column.
### Key Observations
1. **Positional Inversion**: Input coordinates are mirrored vertically in the Output (e.g., top becomes bottom).
2. **Magnitude Amplification**: Single-unit input points become 5-unit output columns.
3. **Color Consistency**: Color coding (red/blue) is preserved through transformation.
4. **Spatial Compression**: Output columns occupy only the bottom 5 rows of the grid despite Input points being distributed across the full grid height.
### Interpretation
This diagram illustrates a coordinate transformation process with three key characteristics:
1. **Positional Mapping**: Maintains horizontal alignment while inverting vertical positioning
2. **Magnitude Conversion**: Transforms discrete points into aggregated vertical bars
3. **Dimensional Scaling**: Compresses vertical dimension by a factor of 5:1
The transformation appears to represent a data processing pipeline where:
- Input points (possibly raw data samples) are converted into
- Output distributions (possibly frequency counts or aggregated measurements)
The consistent color mapping suggests categorical preservation through the transformation, while the vertical scaling implies a normalization or standardization process. The diagonal Input pattern becoming vertical Output columns may indicate a feature extraction or dimensionality reduction operation.