## Line Chart: GLRS vs. ICC
### Overview
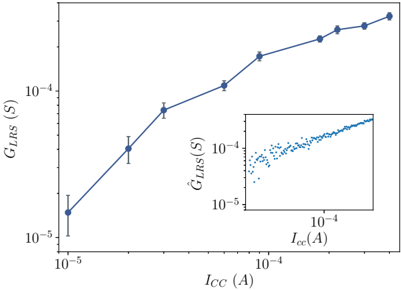
The image contains a line chart with error bars and an inset scatter plot. The main chart shows the relationship between GLRS (conductance in the low resistance state) and ICC (compliance current), both plotted on logarithmic scales. The inset plot shows a similar relationship, but with a different notation for GLRS.
### Components/Axes
**Main Chart:**
* **X-axis (horizontal):** ICC (A) - Compliance Current in Amperes. Logarithmic scale from 10^-5 to 10^-4.
* **Y-axis (vertical):** GLRS (S) - Conductance in Siemens. Logarithmic scale from 10^-5 to 10^-4.
* **Data Series:** A single data series represented by a blue line with error bars.
**Inset Chart:**
* **X-axis (horizontal):** ICC (A) - Compliance Current in Amperes. Logarithmic scale from 10^-5 to 10^-4.
* **Y-axis (vertical):** ĜLRS(S) - Conductance in Siemens. Logarithmic scale from 10^-5 to 10^-4.
* **Data Series:** A scatter plot of blue points.
### Detailed Analysis
**Main Chart Data:**
The blue line represents the relationship between ICC and GLRS. The trend is generally upward, indicating that as the compliance current increases, the conductance also increases.
* **ICC = 10^-5 A:** GLRS ≈ 1.2 x 10^-5 S, with an error bar extending approximately from 0.8 x 10^-5 S to 1.6 x 10^-5 S.
* **ICC ≈ 2 x 10^-5 A:** GLRS ≈ 3.5 x 10^-5 S, with an error bar extending approximately from 3 x 10^-5 S to 4 x 10^-5 S.
* **ICC ≈ 4 x 10^-5 A:** GLRS ≈ 6.5 x 10^-5 S, with an error bar extending approximately from 6 x 10^-5 S to 7 x 10^-5 S.
* **ICC ≈ 6 x 10^-5 A:** GLRS ≈ 8.5 x 10^-5 S, with an error bar extending approximately from 8 x 10^-5 S to 9 x 10^-5 S.
* **ICC ≈ 8 x 10^-5 A:** GLRS ≈ 1.0 x 10^-4 S, with an error bar extending approximately from 9.5 x 10^-5 S to 1.05 x 10^-4 S.
* **ICC ≈ 1.2 x 10^-4 A:** GLRS ≈ 1.2 x 10^-4 S, with an error bar extending approximately from 1.15 x 10^-4 S to 1.25 x 10^-4 S.
* **ICC ≈ 1.5 x 10^-4 A:** GLRS ≈ 1.3 x 10^-4 S, with an error bar extending approximately from 1.25 x 10^-4 S to 1.35 x 10^-4 S.
* **ICC ≈ 2 x 10^-4 A:** GLRS ≈ 1.4 x 10^-4 S, with an error bar extending approximately from 1.35 x 10^-4 S to 1.45 x 10^-4 S.
**Inset Chart Data:**
The inset chart shows a scatter plot of ĜLRS(S) vs. ICC(A). The trend is similar to the main chart, with ĜLRS generally increasing as ICC increases. The data is more scattered compared to the main chart.
### Key Observations
* Both charts show a positive correlation between compliance current (ICC) and conductance (GLRS or ĜLRS).
* The main chart provides a clearer view of the trend due to the line connecting the data points and the presence of error bars.
* The inset chart shows a more granular view of the data, but the scatter makes it harder to discern the exact relationship.
* The rate of increase in GLRS appears to decrease as ICC increases, suggesting a saturation effect.
### Interpretation
The data suggests that increasing the compliance current during the switching process leads to a higher conductance in the low resistance state (LRS). This could be due to the formation of more conductive filaments or the enlargement of existing filaments within the device. The saturation effect observed at higher ICC values might indicate a limit to the number or size of filaments that can be formed. The inset plot likely represents raw data, while the main plot represents processed or averaged data, hence the smoother trend and error bars. The difference in notation (GLRS vs. ĜLRS) might indicate different measurement techniques or data processing methods.