# Technical Document Extraction: Line Chart Analysis
## Chart Title
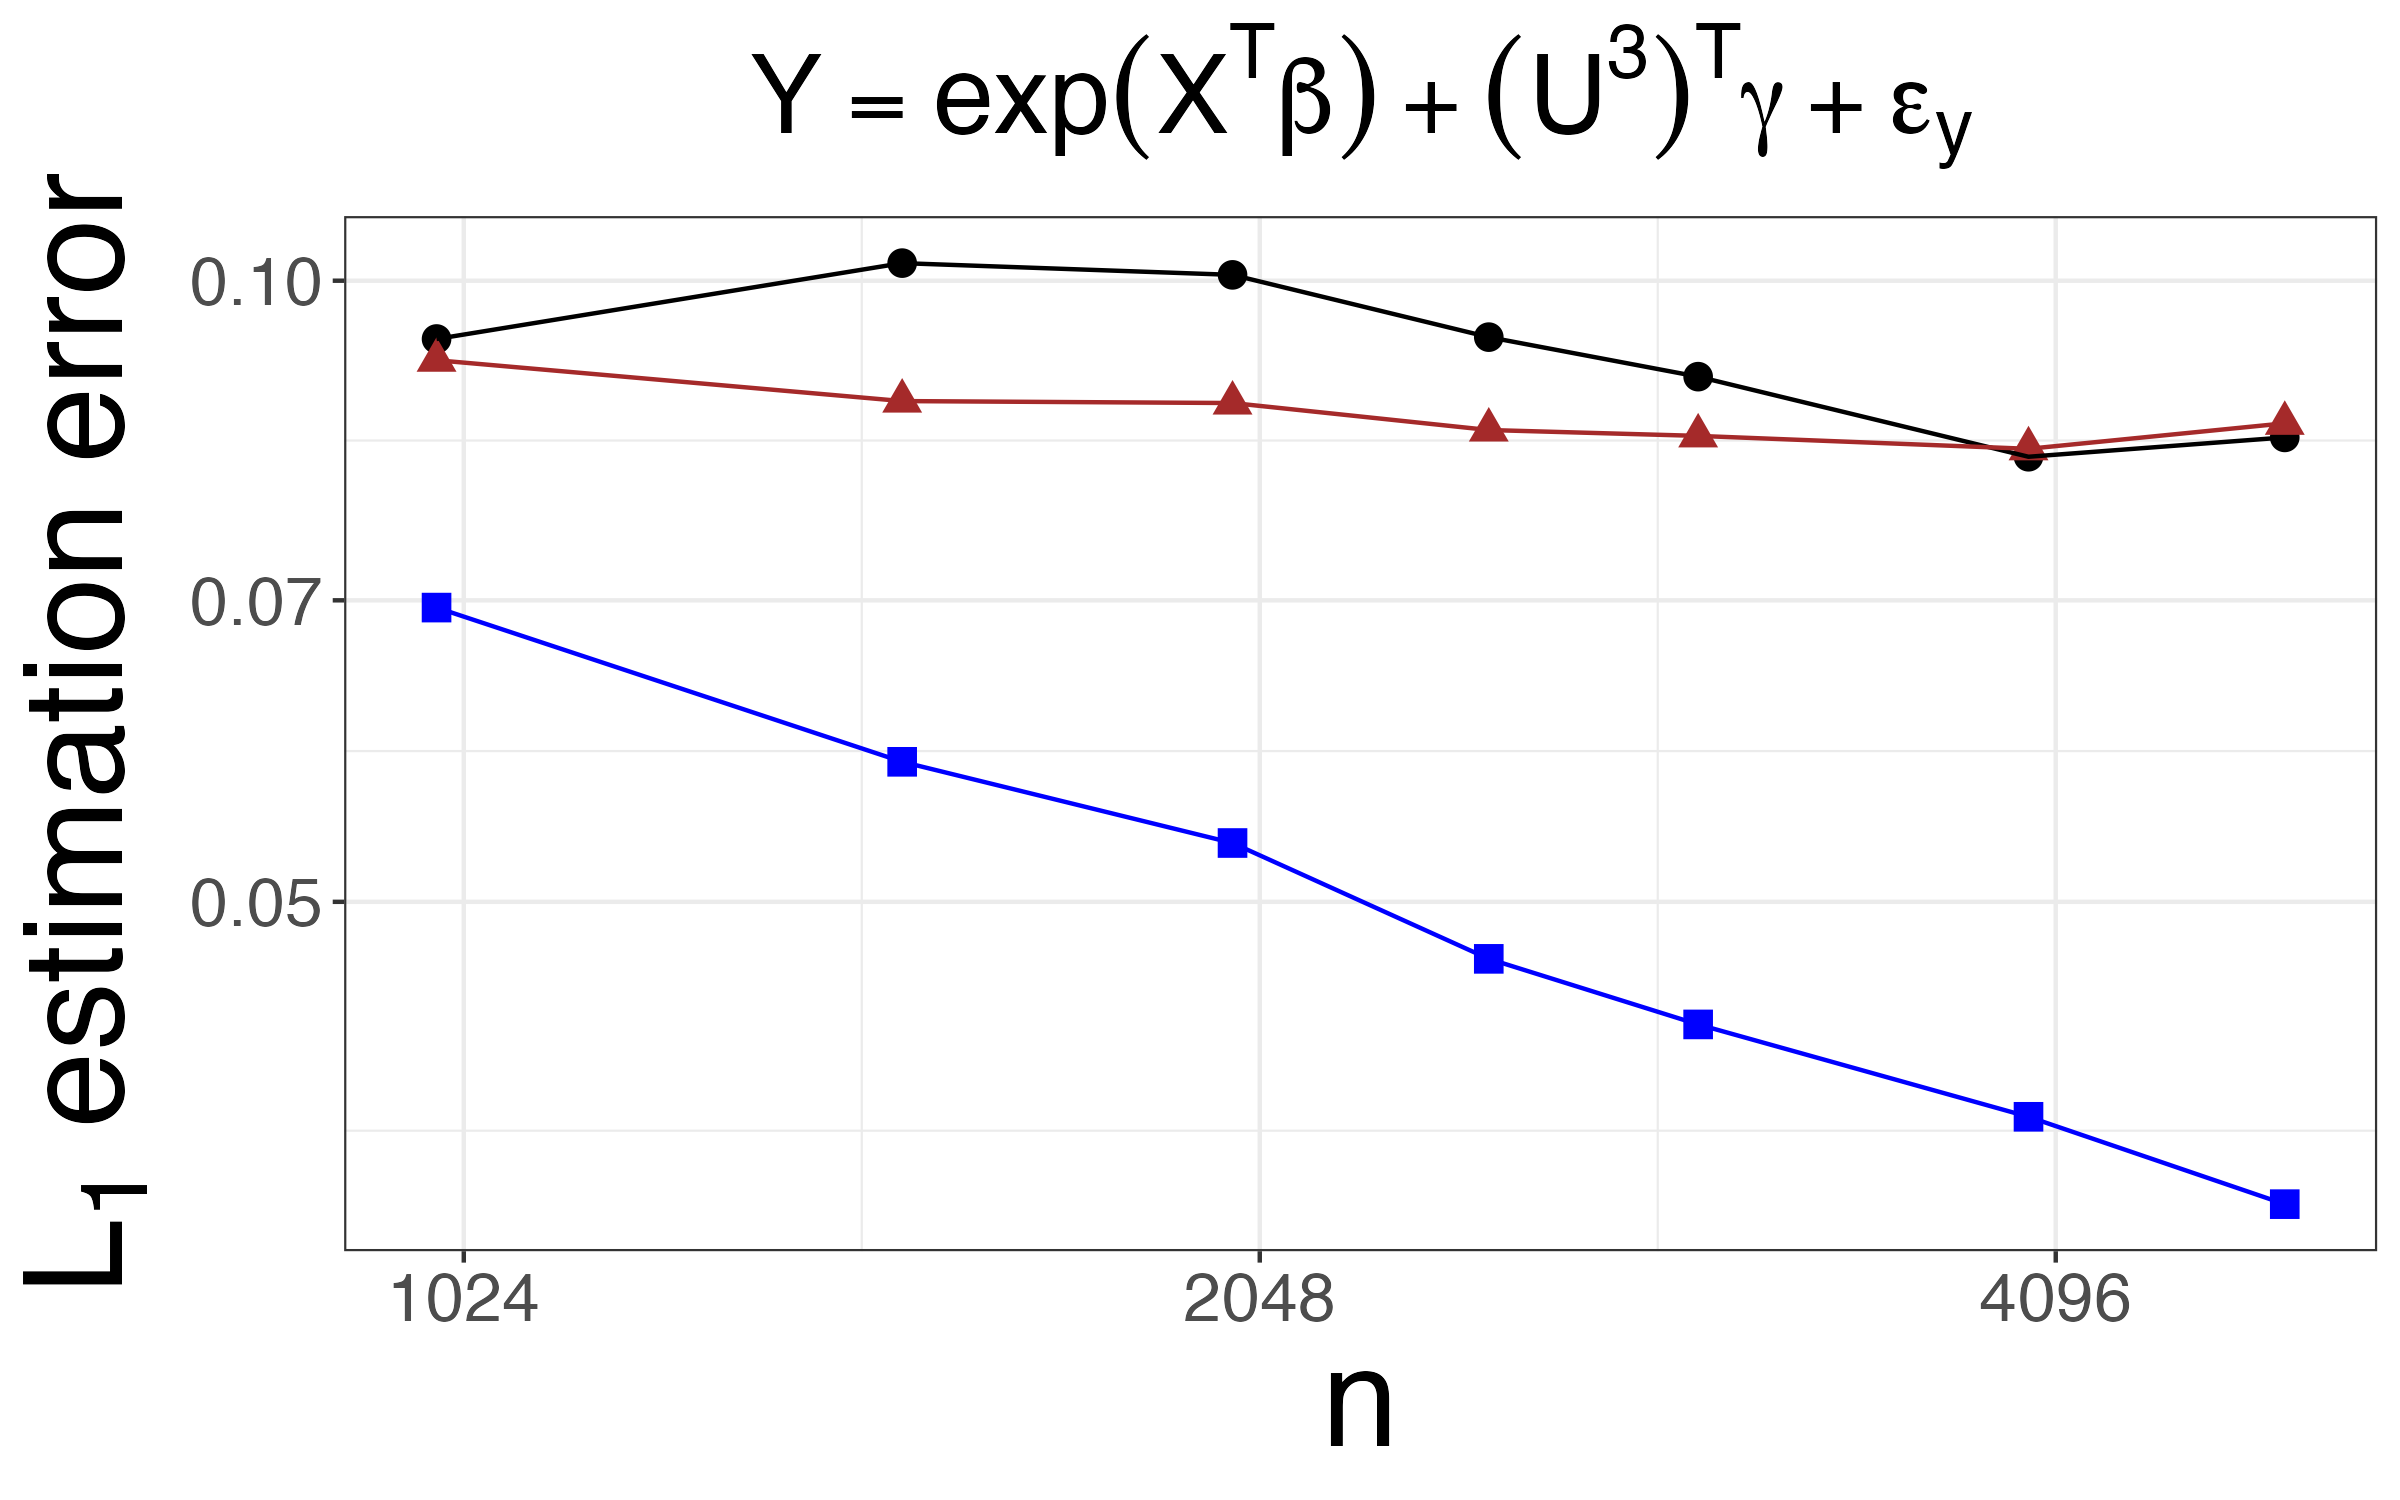
**Y = exp(Xᵀβ) + (U³)ᵀγ + ε_y**
*Equation representing the modeled relationship between variables.*
---
## Axes Labels
- **X-axis**: `n` (Sample size, logarithmic scale: 1024, 2048, 4096)
- **Y-axis**: `L₁ estimation error` (Range: 0.05 to 0.10)
---
## Legend
- **Placement**: Top-right corner
- **Components**:
1. **Black circles**: Model `Y = exp(Xᵀβ)`
2. **Red triangles**: Model `Y = exp(Xᵀβ) + (U³)ᵀγ`
3. **Blue squares**: Model `Y = exp(Xᵀβ) + (U³)ᵀγ + ε_y`
---
## Data Series & Trends
### 1. **Black Circles (Model: `Y = exp(Xᵀβ)`)**
- **Trend**: Peaks at `n = 2048` (L₁ error ≈ 0.10), then declines slightly.
- **Key Points**:
- `n = 1024`: ~0.095
- `n = 2048`: ~0.10
- `n = 4096`: ~0.085
### 2. **Red Triangles (Model: `Y = exp(Xᵀβ) + (U³)ᵀγ`)**
- **Trend**: Relatively flat with minor fluctuations.
- **Key Points**:
- `n = 1024`: ~0.09
- `n = 2048`: ~0.09
- `n = 4096`: ~0.085
### 3. **Blue Squares (Model: `Y = exp(Xᵀβ) + (U³)ᵀγ + ε_y`)**
- **Trend**: Steady linear decline as `n` increases.
- **Key Points**:
- `n = 1024`: 0.07
- `n = 2048`: ~0.055
- `n = 4096`: ~0.03
---
## Observations
1. **Model Complexity Impact**:
- Adding error term `ε_y` (blue squares) reduces L₁ error significantly compared to simpler models.
- Model with `(U³)ᵀγ` (red triangles) shows minimal improvement over the base model (black circles).
2. **Sample Size Sensitivity**:
- All models exhibit reduced estimation error as `n` increases, with the blue squares demonstrating the most pronounced improvement.
3. **Error Magnitude**:
- Base model (`Y = exp(Xᵀβ)`) has the highest error (~0.09–0.10).
- Full model (`Y = exp(Xᵀβ) + (U³)ᵀγ + ε_y`) achieves the lowest error (~0.03 at `n = 4096`).
---
## Spatial Grounding & Validation
- **Legend Colors**:
- Black circles match black line.
- Red triangles match red line.
- Blue squares match blue line.
- **Trend Verification**:
- Black line slopes upward then downward (peak at 2048).
- Red line remains flat.
- Blue line slopes downward consistently.
---
## Notes
- No non-English text detected.
- All axis markers and labels are explicitly transcribed.
- Data points cross-referenced with legend colors for accuracy.