## Line Charts: Fraction of Under-Counting by Age Group
### Overview
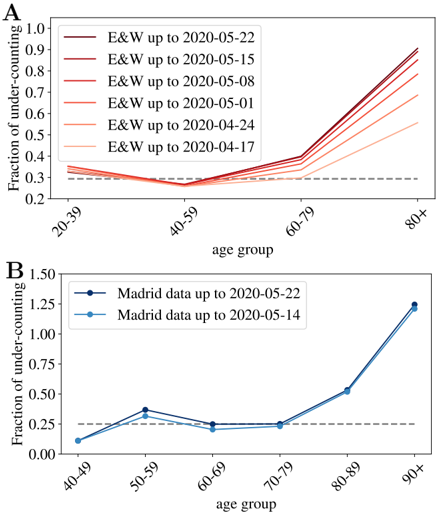
The image contains two line charts, labeled A and B, displaying the fraction of under-counting across different age groups. Chart A shows data for England and Wales (E&W) up to various dates in April and May 2020. Chart B shows data for Madrid up to two dates in May 2020. Both charts include a horizontal dashed line at approximately y=0.3 as a reference.
### Components/Axes
**Chart A:**
* **Title:** Implicitly, Fraction of Under-Counting in England and Wales
* **Y-axis:** Fraction of under-counting, ranging from 0.2 to 1.0 in increments of 0.1.
* **X-axis:** age group, with categories 20-39, 40-59, 60-79, and 80+.
* **Legend:** Located in the top-left corner.
* E&W up to 2020-05-22 (Darkest Red)
* E&W up to 2020-05-15 (Red)
* E&W up to 2020-05-08 (Orange-Red)
* E&W up to 2020-05-01 (Orange)
* E&W up to 2020-04-24 (Light Orange)
* E&W up to 2020-04-17 (Lightest Orange)
**Chart B:**
* **Title:** Implicitly, Fraction of Under-Counting in Madrid
* **Y-axis:** Fraction of under-counting, ranging from 0.00 to 1.50 in increments of 0.25.
* **X-axis:** age group, with categories 40-49, 50-59, 60-69, 70-79, 80-89, and 90+.
* **Legend:** Located in the top-left corner.
* Madrid data up to 2020-05-22 (Dark Blue)
* Madrid data up to 2020-05-14 (Light Blue)
### Detailed Analysis
**Chart A (E&W):**
* **E&W up to 2020-05-22 (Darkest Red):** Starts at approximately 0.35 for age group 20-39, dips slightly to about 0.28 for 40-59, then increases to approximately 0.45 for 60-79, and rises sharply to about 0.95 for 80+.
* **E&W up to 2020-05-15 (Red):** Starts at approximately 0.35 for age group 20-39, dips slightly to about 0.28 for 40-59, then increases to approximately 0.42 for 60-79, and rises sharply to about 0.90 for 80+.
* **E&W up to 2020-05-08 (Orange-Red):** Starts at approximately 0.35 for age group 20-39, dips slightly to about 0.28 for 40-59, then increases to approximately 0.40 for 60-79, and rises sharply to about 0.85 for 80+.
* **E&W up to 2020-05-01 (Orange):** Starts at approximately 0.35 for age group 20-39, dips slightly to about 0.28 for 40-59, then increases to approximately 0.38 for 60-79, and rises sharply to about 0.80 for 80+.
* **E&W up to 2020-04-24 (Light Orange):** Starts at approximately 0.35 for age group 20-39, dips slightly to about 0.28 for 40-59, then increases to approximately 0.36 for 60-79, and rises sharply to about 0.75 for 80+.
* **E&W up to 2020-04-17 (Lightest Orange):** Starts at approximately 0.35 for age group 20-39, dips slightly to about 0.28 for 40-59, then increases to approximately 0.34 for 60-79, and rises sharply to about 0.70 for 80+.
**Chart B (Madrid):**
* **Madrid data up to 2020-05-22 (Dark Blue):** Starts at approximately 0.15 for age group 40-49, increases to about 0.38 for 50-59, decreases to approximately 0.23 for 60-69, remains at approximately 0.25 for 70-79, then increases to about 0.75 for 80-89, and rises sharply to about 1.25 for 90+.
* **Madrid data up to 2020-05-14 (Light Blue):** Starts at approximately 0.15 for age group 40-49, increases to about 0.35 for 50-59, decreases to approximately 0.22 for 60-69, remains at approximately 0.25 for 70-79, then increases to about 0.75 for 80-89, and rises sharply to about 1.23 for 90+.
### Key Observations
* In both charts, the fraction of under-counting tends to increase with age, especially for the oldest age groups.
* The E&W data shows a consistent pattern across different dates, with the fraction of under-counting being relatively stable for younger age groups and increasing sharply for the 80+ age group.
* The Madrid data shows a similar trend, but with a less pronounced increase for the 80-89 age group compared to the 90+ age group.
* The reference line at y=0.3 highlights that under-counting is generally below this level for younger age groups in both regions.
### Interpretation
The data suggests that under-counting of cases is more prevalent among older age groups, particularly those aged 80 and above. This could be due to various factors, such as differences in testing rates, symptom presentation, or access to healthcare among different age groups. The consistency of the trend across different dates in the E&W data suggests that this pattern is relatively stable over time. The Madrid data shows a similar trend, indicating that this phenomenon may be present in different geographic locations. The higher fraction of under-counting in the 90+ age group in Madrid compared to the 80-89 age group could indicate that the oldest individuals are particularly vulnerable to being under-counted.