# Technical Document Extraction: Probability Density vs Remaining Useful Life
## 1. Axis Labels and Markers
- **Y-Axis**:
- Label: "Probability density"
- Scale: 0.0 to 1.0 in increments of 0.2
- Ticks: 0.0, 0.2, 0.4, 0.6, 0.8, 1.0
- **X-Axis**:
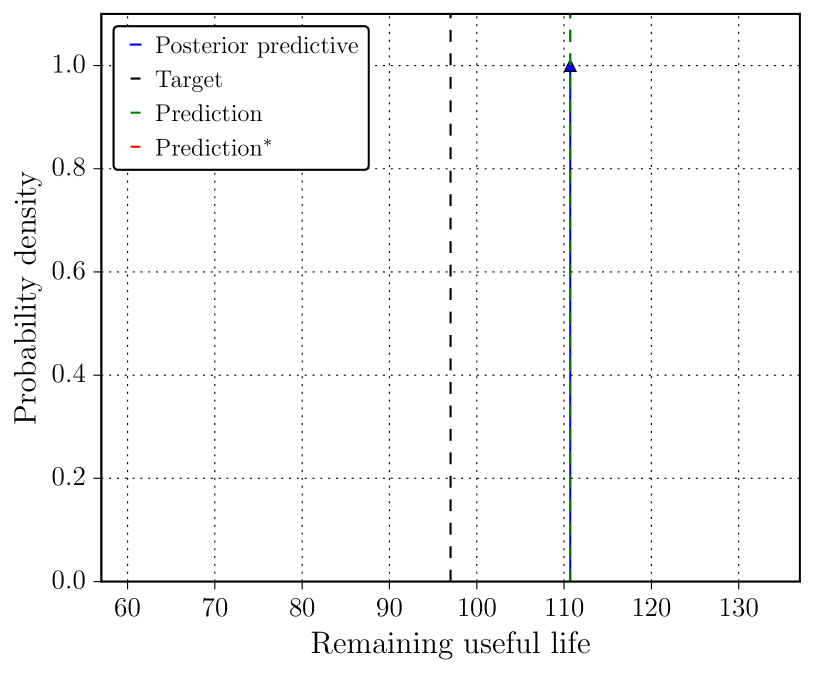
- Label: "Remaining useful life"
- Scale: 60 to 130 in increments of 10
- Ticks: 60, 70, 80, 90, 100, 110, 120, 130
## 2. Legend
- **Position**: Top-left corner (spatial grounding: [x=0, y=0.95] normalized)
- **Entries**:
- **Blue**: Posterior predictive
- **Black**: Target
- **Green**: Prediction
- **Red**: Prediction*
## 3. Key Components and Trends
### A. Posterior Predictive (Blue Line)
- **Visual Trend**: Sharp vertical peak at x=110
- **Data Point**:
- x=110, y=1.0 (maximum probability density)
- **Cross-Reference**: Matches legend entry "Posterior predictive" (blue)
### B. Target (Black Dashed Line)
- **Visual Trend**: Vertical dashed line at x=100
- **Data Point**:
- x=100, y=1.0 (implied by line placement)
- **Cross-Reference**: Matches legend entry "Target" (black)
### C. Prediction (Green Dashed Line)
- **Visual Trend**: Vertical dashed line at x=110
- **Data Point**:
- x=110, y=1.0 (implied by line placement)
- **Cross-Reference**: Matches legend entry "Prediction" (green)
### D. Prediction* (Red Dashed Line)
- **Visual Trend**: Vertical dashed line at x=100
- **Data Point**:
- x=100, y=1.0 (implied by line placement)
- **Cross-Reference**: Matches legend entry "Prediction*" (red)
## 4. Spatial Grounding of Elements
- **Legend**: Top-left corner (no explicit coordinates provided)
- **Lines**:
- Posterior predictive: Vertical at x=110
- Target: Vertical at x=100
- Prediction: Vertical at x=110
- Prediction*: Vertical at x=100
## 5. Trend Verification
- **Posterior predictive**: Peaks at x=110 (highest probability density)
- **Target/Prediction***: Vertical lines at x=100 and x=110, respectively
- **Prediction**: Coincides with Posterior predictive at x=110
## 6. Data Table (Not Applicable)
- No embedded data table present in the image.
## 7. Language Declaration
- **Primary Language**: English
- **No additional languages detected**.
## 8. Summary of Key Trends
- The **Posterior predictive** and **Prediction** lines align at x=110, indicating maximum probability density for remaining useful life at this value.
- The **Target** and **Prediction*** lines align at x=100, suggesting a reference or baseline value for comparison.
- All lines exhibit vertical peaks, indicating discrete probability density values at specific remaining useful life intervals.