## Histogram: First Correct Answer Emergence Distribution
### Overview
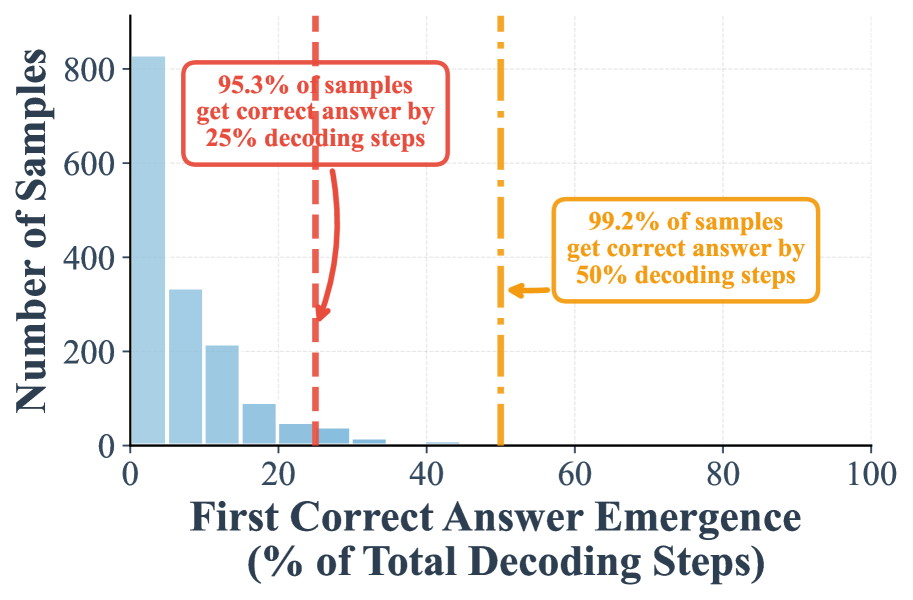
The image is a histogram chart illustrating the distribution of when a model first produces a correct answer during a decoding process, measured as a percentage of the total decoding steps. The chart includes two key annotations highlighting cumulative percentages at specific thresholds.
### Components/Axes
* **Chart Type:** Histogram (bar chart).
* **X-Axis:**
* **Title:** "First Correct Answer Emergence (% of Total Decoding Steps)"
* **Scale:** Linear scale from 0 to 100, with major tick marks at 0, 20, 40, 60, 80, 100.
* **Y-Axis:**
* **Title:** "Number of Samples"
* **Scale:** Linear scale from 0 to 800, with major tick marks at 0, 200, 400, 600, 800.
* **Data Series:** A single series represented by light blue vertical bars. The height of each bar represents the count of samples whose first correct answer emerged within that percentage bin.
* **Annotations:**
1. **Red Dashed Vertical Line & Box (Position: Top-Left quadrant, line at x=25):**
* **Text:** "95.3% of samples get correct answer by 25% decoding steps"
* **Visual Cue:** A red arrow points from the text box down to the dashed line.
2. **Orange Dashed Vertical Line & Box (Position: Center-Right, line at x=50):**
* **Text:** "99.2% of samples get correct answer by 50% decoding steps"
* **Visual Cue:** An orange arrow points from the text box left to the dashed line.
* **Background:** White with a faint gray grid.
### Detailed Analysis
* **Distribution Shape:** The histogram is strongly right-skewed. The tallest bar is at the far left (0-5% bin), indicating the highest frequency of samples achieve their first correct answer very early in the decoding process.
* **Bar Height Trends (Approximate Values):**
* **0-5% bin:** ~820 samples (tallest bar).
* **5-10% bin:** ~330 samples.
* **10-15% bin:** ~210 samples.
* **15-20% bin:** ~90 samples.
* **20-25% bin:** ~40 samples.
* **25-30% bin:** ~30 samples.
* **30-35% bin:** ~10 samples.
* **Bins beyond 35%:** Bars are very short, approaching zero, indicating very few samples require more than 35% of decoding steps for their first correct answer.
* **Key Thresholds (from annotations):**
* By the **25%** mark on the x-axis, **95.3%** of all samples have already achieved their first correct answer.
* By the **50%** mark on the x-axis, **99.2%** of all samples have achieved their first correct answer.
### Key Observations
1. **Extreme Early Success:** The vast majority of correct answers emerge in the first quarter of the decoding process. The distribution is heavily concentrated between 0% and 20%.
2. **Diminishing Returns:** After the 25% threshold, the number of new samples achieving their first correct answer drops precipitously. The tail of the distribution beyond 35% is negligible.
3. **High Cumulative Coverage:** The two annotations confirm that nearly all samples (99.2%) succeed by the halfway point of the decoding steps, suggesting the process is highly efficient for the evaluated task.
### Interpretation
This histogram demonstrates the efficiency and early convergence of the decoding process being analyzed. The data suggests that for the given task and model, the correct solution is typically found very early. The "first correct answer" is not evenly distributed over time but is heavily front-loaded.
The 95.3% and 99.2% thresholds are critical performance metrics. They indicate that allocating computational resources (decoding steps) beyond 50% yields minimal additional success, as only 0.8% of samples require more than half the steps. This has practical implications for optimizing inference speed and cost: one could potentially truncate the decoding process early (e.g., at 50% of a predefined maximum step count) with a very high probability of having already obtained the correct answer for nearly all inputs. The chart effectively argues that the model's "thinking" or search process is highly effective in its initial stages for this specific evaluation.