## Bar Chart: First Correct Answer Emergence by Decoding Steps
### Overview
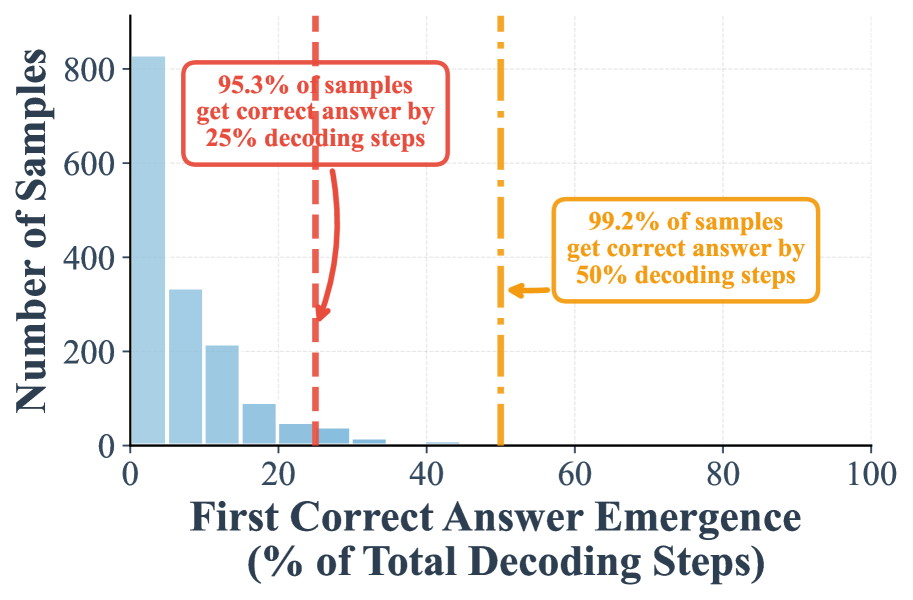
The chart visualizes the distribution of samples based on the percentage of total decoding steps required to produce the first correct answer. Two vertical dashed lines highlight key thresholds (25% and 50% decoding steps), with annotations indicating cumulative sample coverage at these points.
### Components/Axes
- **Y-Axis**: "Number of Samples" (linear scale, 0–800+).
- **X-Axis**: "First Correct Answer Emergence (% of Total Decoding Steps)" (0–100%).
- **Annotations**:
- **Red Dashed Line (~25%)**: "95.3% of samples get correct answer by 25% decoding steps."
- **Yellow Dashed Line (~50%)**: "99.2% of samples get correct answer by 50% decoding steps."
### Detailed Analysis
- **Bar Distribution**:
- The majority of samples (800+) cluster near 0–10% decoding steps, indicating most correct answers emerge early.
- The count decreases sharply as decoding steps increase, with fewer samples requiring higher percentages (e.g., ~200 samples at 10–20%, ~100 at 20–30%).
- Bars become sparse beyond 30%, with minimal samples beyond 50%.
- **Thresholds**:
- At **25% decoding steps**, 95.3% of samples achieve correctness (red annotation).
- At **50% decoding steps**, coverage increases to 99.2% (yellow annotation), suggesting diminishing returns after 25%.
### Key Observations
1. **Early Emergence Dominance**: Over 95% of samples resolve correctness within the first 25% of decoding steps.
2. **Rapid Saturation**: Only a 3.9% improvement in coverage occurs between 25% and 50% decoding steps.
3. **Long-Tail Decline**: Few samples require >50% decoding steps, indicating inefficiency or complexity in later stages.
### Interpretation
The data demonstrates that the system under analysis is highly efficient, with the vast majority of correct answers emerging early in the decoding process. The steep decline in sample counts beyond 25% suggests that extending decoding steps beyond this threshold yields minimal additional accuracy gains. This could inform optimization strategies, such as capping decoding steps at 25% to balance accuracy and computational cost. The near-total coverage (99.2%) at 50% implies that the system is robust, though the long tail of samples requiring >50% steps may warrant further investigation into edge cases or model limitations.