\n
## Line Chart: Accuracy vs. Thinking Compute
### Overview
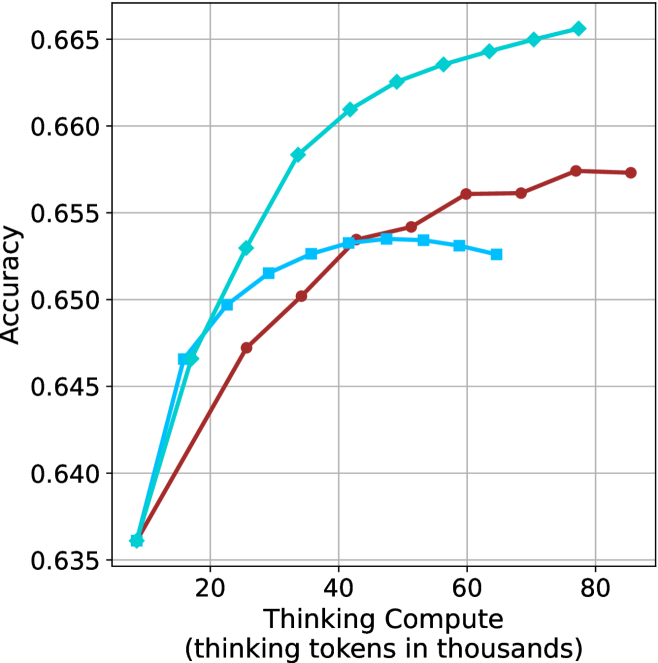
The image presents a line chart illustrating the relationship between "Thinking Compute" (measured in thousands of tokens) and "Accuracy". Three distinct data series are plotted, each represented by a different colored line. The chart demonstrates how accuracy changes as the amount of thinking compute increases.
### Components/Axes
* **X-axis:** "Thinking Compute (thinking tokens in thousands)". Scale ranges from approximately 0 to 80, with markers at 0, 20, 40, 60, and 80.
* **Y-axis:** "Accuracy". Scale ranges from approximately 0.635 to 0.665, with gridlines at 0.640, 0.645, 0.650, 0.655, 0.660, and 0.665.
* **Data Series:** Three lines are present, each with a distinct color:
* Light Blue
* Red
* Teal
### Detailed Analysis
* **Light Blue Line:** This line exhibits a strong upward trend, starting at approximately 0.637 at 0 tokens and reaching approximately 0.664 at 80 tokens. The slope is steepest between 20 and 60 tokens.
* (0, 0.637)
* (20, 0.655)
* (40, 0.662)
* (60, 0.663)
* (80, 0.664)
* **Red Line:** This line also shows an upward trend, but it is less pronounced than the light blue line. It begins at approximately 0.638 at 0 tokens and reaches approximately 0.658 at 80 tokens. The slope is steepest between 0 and 20 tokens, then plateaus.
* (0, 0.638)
* (20, 0.648)
* (40, 0.653)
* (60, 0.655)
* (80, 0.658)
* **Teal Line:** This line initially rises rapidly, then plateaus and even slightly declines. It starts at approximately 0.639 at 0 tokens, peaks around 0.652 at 40 tokens, and then decreases to approximately 0.652 at 80 tokens.
* (0, 0.639)
* (20, 0.651)
* (40, 0.652)
* (60, 0.652)
* (80, 0.652)
### Key Observations
* The light blue line consistently demonstrates the highest accuracy across all values of "Thinking Compute".
* The teal line shows diminishing returns, with accuracy plateauing and slightly decreasing after 40 tokens.
* The red line exhibits the slowest rate of accuracy improvement.
* All three lines start at similar accuracy levels (around 0.637-0.639).
### Interpretation
The chart suggests that increasing "Thinking Compute" generally improves "Accuracy", but the rate of improvement varies significantly depending on the data series. The light blue data series indicates a strong positive correlation between compute and accuracy, suggesting that more compute consistently leads to better performance. The teal line suggests that there is a point of diminishing returns, where additional compute does not yield significant accuracy gains. The red line indicates a more modest improvement in accuracy with increased compute.
This data could be related to the performance of a machine learning model or algorithm, where "Thinking Compute" represents the computational resources allocated to the reasoning process, and "Accuracy" represents the correctness of the model's output. The different lines could represent different model architectures, training methods, or hyperparameter settings. The chart highlights the importance of optimizing compute resources to achieve the best possible accuracy, while also considering the potential for diminishing returns.