## Line Graph: Accuracy vs. Thinking Compute
### Overview
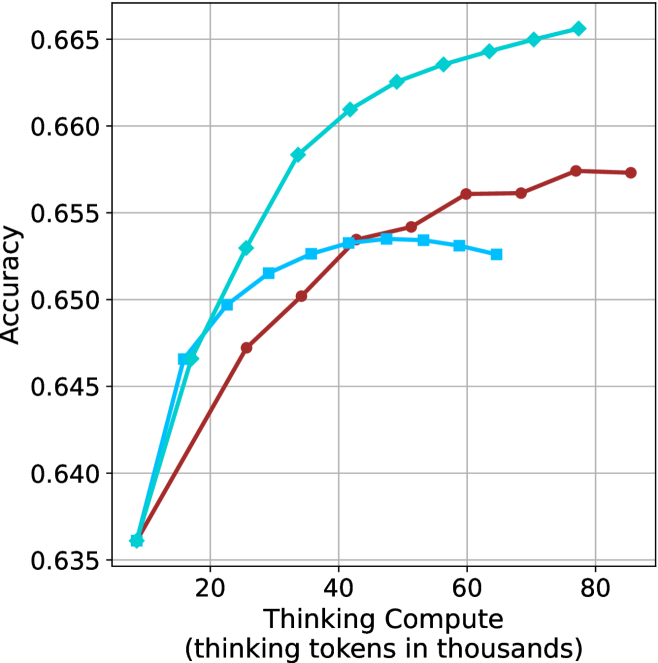
The image depicts a line graph comparing the accuracy of three computational models (Model A, Model B, Model C) across varying levels of "Thinking Compute" (measured in thousands of thinking tokens). The y-axis represents accuracy (ranging from 0.635 to 0.665), while the x-axis represents compute scale (20k to 80k tokens). Three distinct lines—teal, red, and blue—correspond to the models, with trends indicating performance improvements as compute increases.
### Components/Axes
- **X-axis**: "Thinking Compute (thinking tokens in thousands)"
- Scale: 20k to 80k tokens (discrete intervals at 20k, 40k, 60k, 80k).
- **Y-axis**: "Accuracy"
- Scale: 0.635 to 0.665 (increments of 0.005).
- **Legend**: Located on the right side of the graph.
- Teal: Model A
- Red: Model B
- Blue: Model C
### Detailed Analysis
1. **Model A (Teal Line)**:
- Starts at ~0.645 accuracy at 20k tokens.
- Rises sharply to ~0.665 accuracy by 80k tokens.
- Plateau observed after 60k tokens.
- Key data points:
- 20k tokens: ~0.645
- 40k tokens: ~0.660
- 60k tokens: ~0.664
- 80k tokens: ~0.665
2. **Model B (Red Line)**:
- Begins at ~0.647 accuracy at 20k tokens.
- Gradual ascent to ~0.657 accuracy by 80k tokens.
- Plateau observed after 60k tokens.
- Key data points:
- 20k tokens: ~0.647
- 40k tokens: ~0.653
- 60k tokens: ~0.656
- 80k tokens: ~0.657
3. **Model C (Blue Line)**:
- Starts at ~0.646 accuracy at 20k tokens.
- Steeper initial rise than Model B, reaching ~0.656 accuracy by 80k tokens.
- Plateau observed after 60k tokens.
- Key data points:
- 20k tokens: ~0.646
- 40k tokens: ~0.654
- 60k tokens: ~0.656
- 80k tokens: ~0.656
### Key Observations
- **Model A (Teal)** consistently outperforms Models B and C across all compute levels.
- All models exhibit diminishing returns after ~60k tokens, with accuracy plateaus.
- Model C (Blue) shows the steepest initial improvement but lags behind Model A at higher compute levels.
- No anomalies or outliers detected; trends align with expected performance-compute relationships.
### Interpretation
The graph demonstrates that increased compute improves accuracy for all models, but with diminishing marginal gains. Model A achieves the highest efficiency, requiring fewer tokens to reach peak accuracy compared to Models B and C. The plateauing trends suggest that beyond a certain compute threshold (60k tokens), additional resources yield minimal accuracy improvements. This implies a trade-off between computational cost and performance gains, with Model A offering the most cost-effective scaling. The data underscores the importance of optimizing model architecture (as reflected in Model A’s performance) alongside compute allocation.