## Scatter Plot: Statistical Parity vs. Accuracy by SCM Size
### Overview
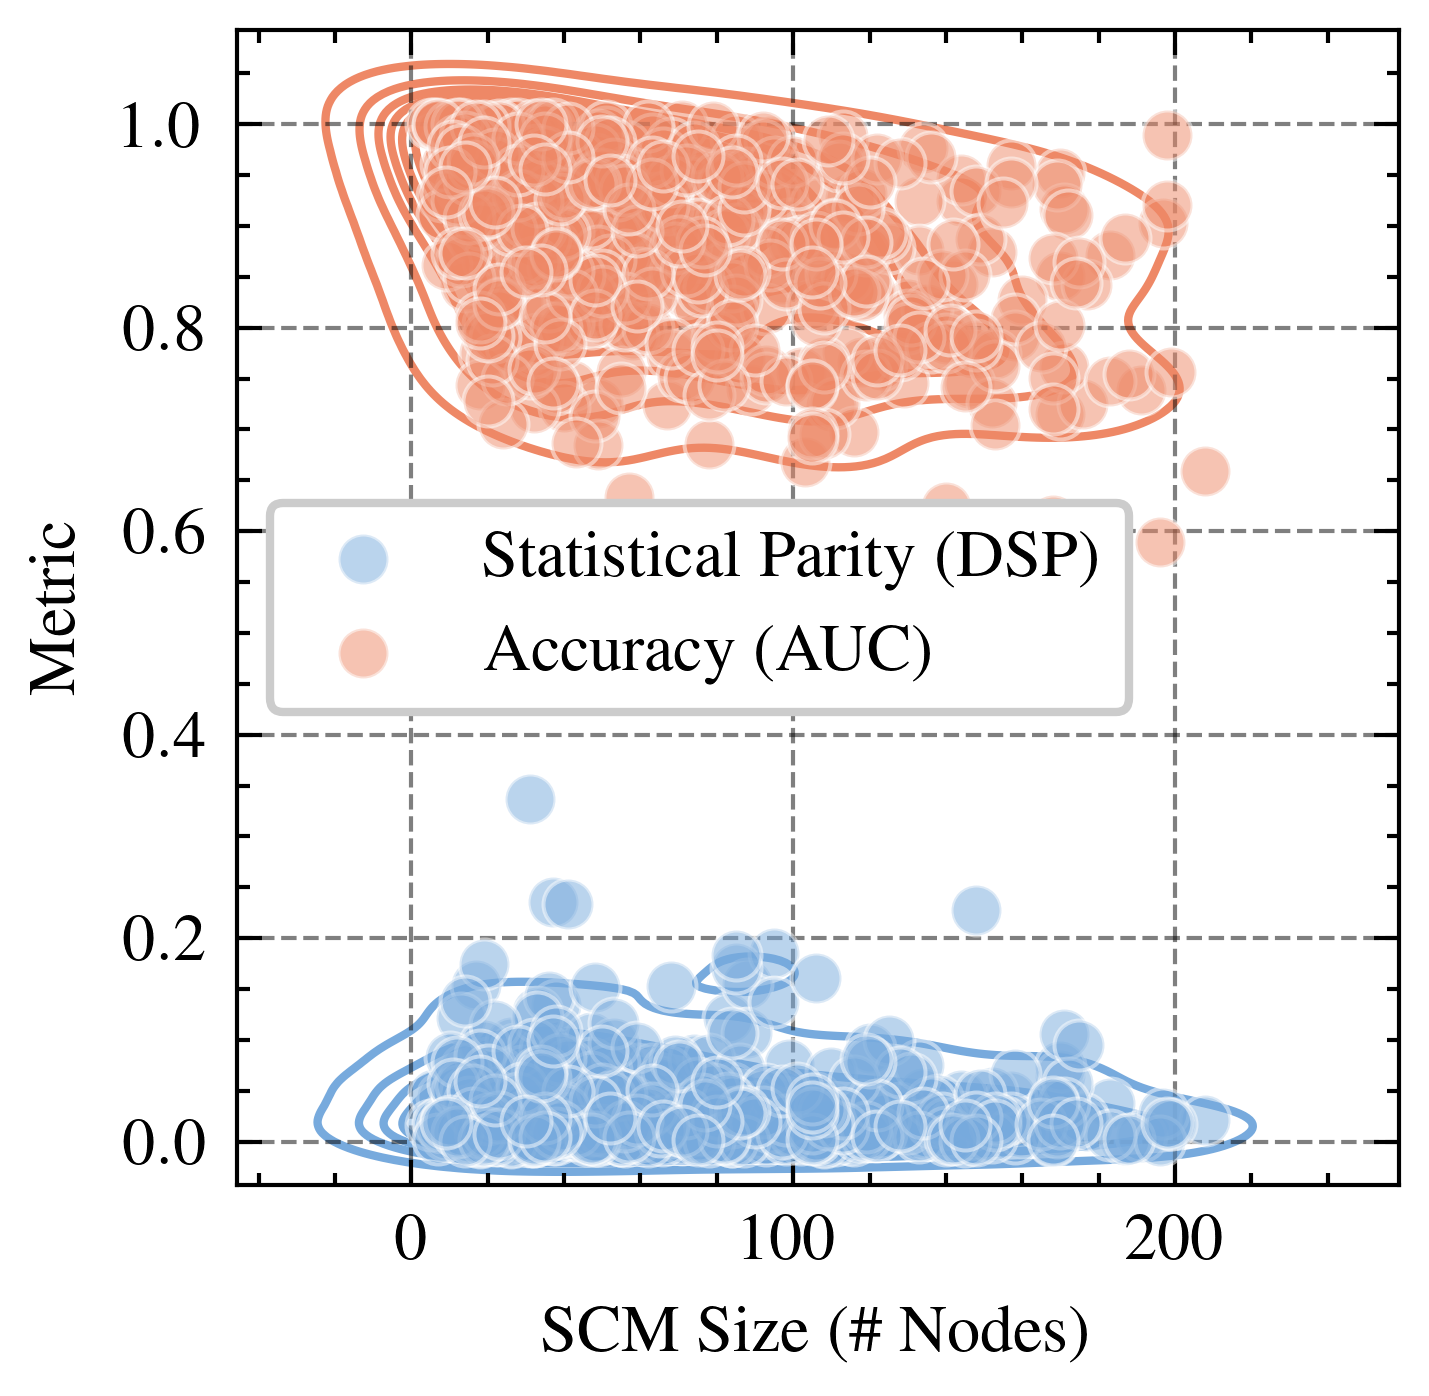
This is a scatter plot comparing two performance metrics—Statistical Parity (DSP) and Accuracy (AUC)—against the size of a Structural Causal Model (SCM), measured in number of nodes. The plot reveals a clear separation between the two metrics, with Accuracy values consistently high and Statistical Parity values consistently low across the range of SCM sizes.
### Components/Axes
* **X-Axis:** Labeled "SCM Size (# Nodes)". The scale runs from 0 to over 200, with major tick marks at 0, 100, and 200. Minor tick marks are present.
* **Y-Axis:** Labeled "Metric". The scale runs from 0.0 to 1.0, with major tick marks at 0.0, 0.2, 0.4, 0.6, 0.8, and 1.0.
* **Legend:** Positioned in the center-left area of the plot, within a white box with a gray border. It contains two entries:
* A light blue circle labeled "Statistical Parity (DSP)".
* A light orange circle labeled "Accuracy (AUC)".
* **Data Series:**
* **Statistical Parity (DSP):** Represented by light blue, semi-transparent circles. The data points are densely clustered in the lower portion of the plot.
* **Accuracy (AUC):** Represented by light orange, semi-transparent circles. The data points are densely clustered in the upper portion of the plot.
* **Density Contours:** Both data series have overlaid contour lines (blue for DSP, orange for AUC) indicating regions of higher point density.
* **Grid:** A dashed gray grid is present, aligned with the major tick marks on both axes.
### Detailed Analysis
**Statistical Parity (DSP) - Blue Series:**
* **Trend Verification:** The blue cluster shows a very slight downward trend as SCM size increases, but the relationship is weak. The primary characteristic is a dense, low-value cluster.
* **Data Distribution:** The vast majority of points lie between y=0.0 and y=0.2. The highest density (indicated by the innermost contour) is concentrated between x=0 to x=100 and y=0.0 to y=0.15.
* **Outliers:** A few outlier points extend upwards, with the highest reaching approximately y=0.35 at an SCM size of around 40 nodes. Another outlier is near y=0.25 at an SCM size of about 150 nodes.
**Accuracy (AUC) - Orange Series:**
* **Trend Verification:** The orange cluster shows no strong upward or downward trend. The values remain consistently high across the entire range of SCM sizes.
* **Data Distribution:** The points are densely packed between y=0.7 and y=1.0. The highest density region (innermost contour) spans from approximately x=20 to x=180 on the x-axis and y=0.8 to y=1.0 on the y-axis.
* **Outliers:** A few points fall below the main cluster, with the lowest reaching approximately y=0.6 at an SCM size near 200 nodes. One point is at y=1.0 near x=200.
### Key Observations
1. **Clear Separation:** There is a stark, non-overlapping separation between the two metrics. All Accuracy (AUC) values are significantly higher than all Statistical Parity (DSP) values.
2. **Metric Stability:** Both metrics show relative stability across SCM sizes. Accuracy remains high, and Statistical Parity remains low, regardless of whether the model has 10 nodes or 200 nodes.
3. **Density Patterns:** The highest density of Accuracy scores is in the high-value region (0.8-1.0), while the highest density of Statistical Parity scores is in the very low-value region (0.0-0.15).
4. **Variance:** The Statistical Parity (DSP) metric appears to have slightly more variance, with a wider spread of outlier points extending upward from its main cluster compared to the tighter cluster of Accuracy scores.
### Interpretation
This plot visualizes a potential fairness-accuracy trade-off in the evaluated models or systems. The data suggests that while the models achieve high predictive performance (AUC consistently near 1.0), they perform poorly on the fairness metric of Statistical Parity (DSP consistently near 0.0). Statistical Parity measures whether positive prediction rates are equal across groups; a value near 0 indicates a significant disparity.
The lack of a strong trend with SCM size implies that simply increasing the complexity or size of the underlying causal model does not inherently resolve this fairness gap. The problem appears systemic to the models being tested. The investigation should focus on why fairness is compromised despite high accuracy, and whether techniques for improving fairness (e.g., constraints, re-weighting, adversarial debiasing) can shift the blue cluster upward without pulling the orange cluster downward. The outliers in the DSP series (points near 0.35) are particularly interesting, as they represent cases where better fairness was achieved; analyzing what differentiates these cases could provide insights for improvement.