## Scatter Plot: Statistical Parity vs. Accuracy by SCM Size
### Overview
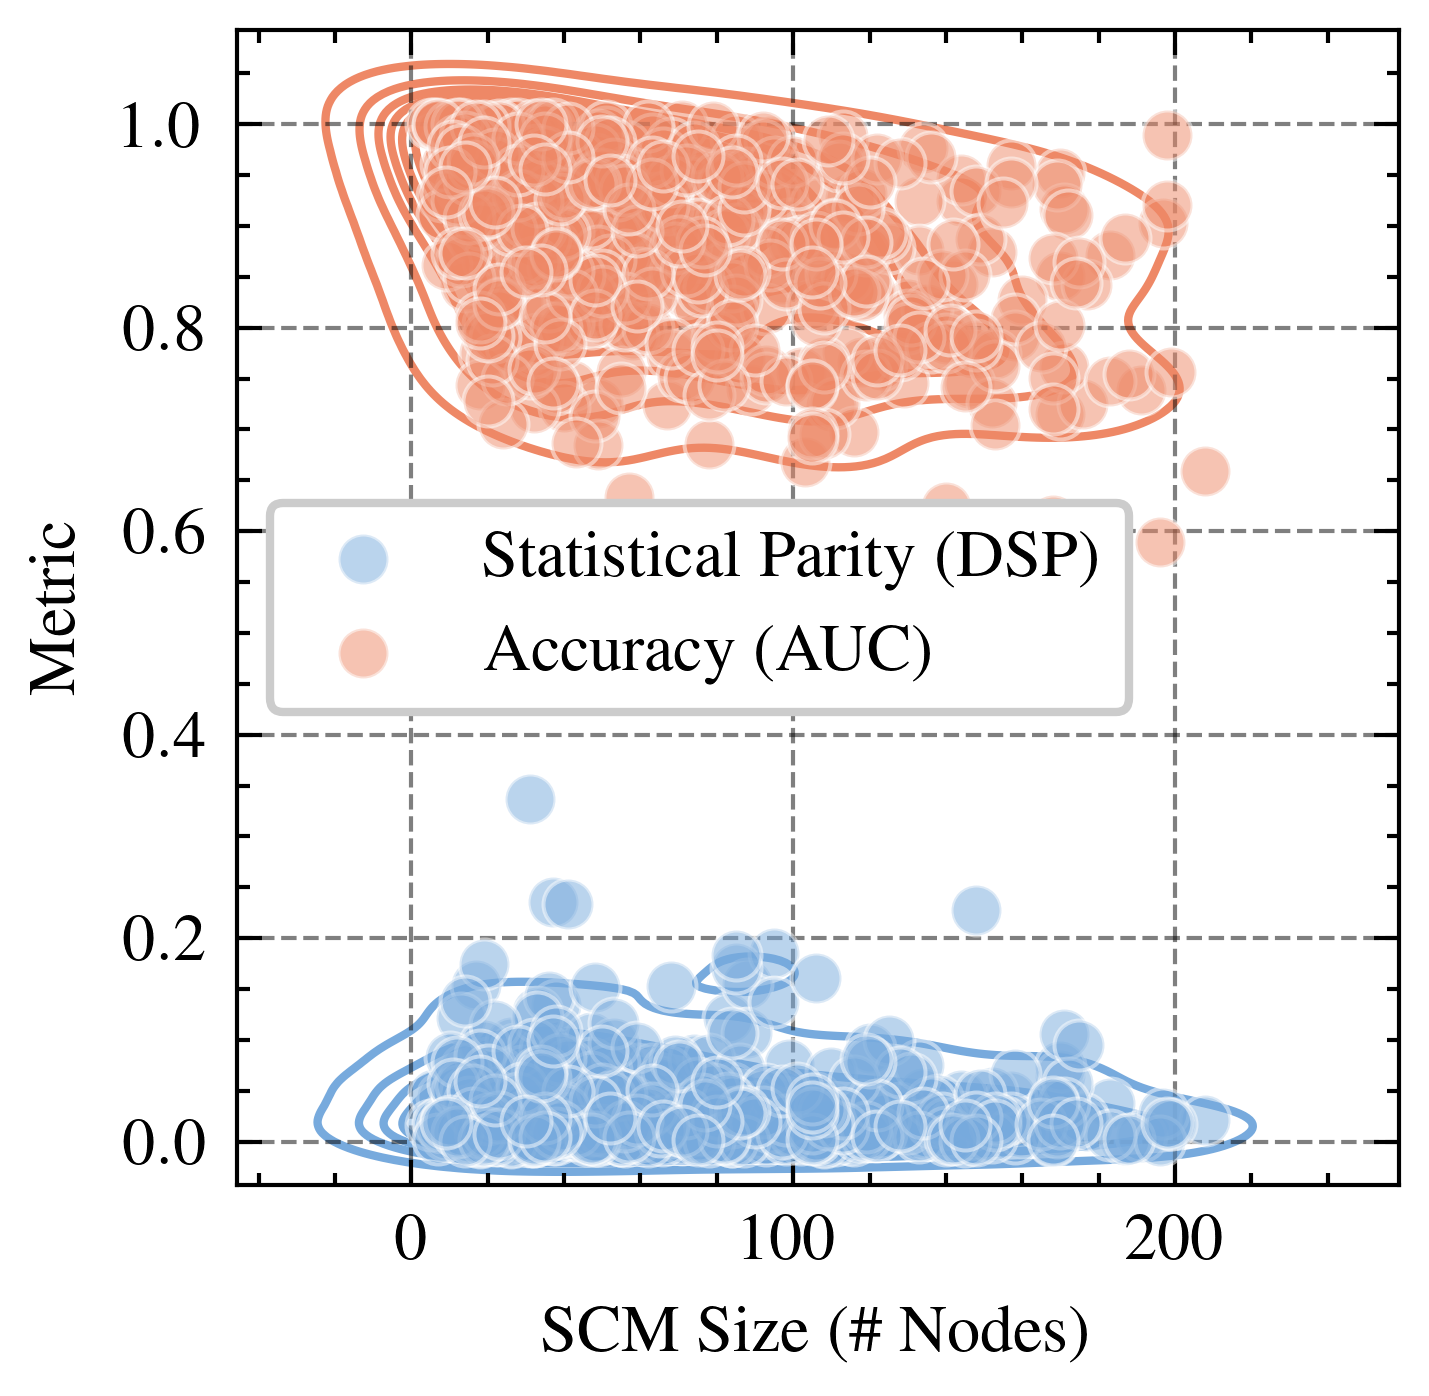
The image is a scatter plot comparing two metrics—Statistical Parity (DSP) and Accuracy (AUC)—across varying SCM sizes (number of nodes). Two distinct clusters are visible: blue points represent DSP, while orange points represent AUC. The plot includes contour lines to indicate data density.
### Components/Axes
- **X-axis**: Labeled "SCM Size (# Nodes)" with a range from 0 to 200.
- **Y-axis**: Labeled "Metric" with a range from 0.0 to 1.0.
- **Legend**: Located in the top-left corner, with:
- **Blue**: Statistical Parity (DSP)
- **Orange**: Accuracy (AUC)
- **Data Points**:
- Blue circles (DSP) clustered near the bottom-left.
- Orange circles (AUC) clustered near the top-right.
- **Contour Lines**: Overlaid on both clusters to highlight density.
### Detailed Analysis
1. **Statistical Parity (DSP)**:
- **Trend**: Blue points form a dense cluster concentrated in the lower-left quadrant (x ≈ 0–100, y ≈ 0.0–0.2). Contour lines show higher density near x ≈ 50 and y ≈ 0.1.
- **Outliers**: A few isolated blue points appear near x ≈ 150–200 and y ≈ 0.2–0.3, but these are sparse.
- **Distribution**: The majority of DSP values are tightly grouped, suggesting low variability in smaller SCM sizes.
2. **Accuracy (AUC)**:
- **Trend**: Orange points dominate the upper-right quadrant (x ≈ 100–200, y ≈ 0.6–1.0). Contour lines indicate peak density near x ≈ 150 and y ≈ 0.8.
- **Outliers**: A small cluster of orange points appears near x ≈ 50–100 and y ≈ 0.6–0.7, but these are less dense than the main cluster.
- **Distribution**: AUC values are more spread out but still concentrated in the upper range, indicating higher variability in larger SCM sizes.
### Key Observations
- **Inverse Relationship**: DSP decreases as SCM size increases, while AUC increases with SCM size.
- **Cluster Separation**: The two metrics occupy distinct regions of the plot, with minimal overlap.
- **Density Patterns**: DSP is tightly clustered at lower metric values, whereas AUC is spread across higher metric values but still concentrated.
### Interpretation
The data suggests a trade-off between statistical parity and accuracy as SCM size increases:
- **Statistical Parity (DSP)**: Smaller SCM sizes (x ≈ 0–100) exhibit higher statistical parity (y ≈ 0.1–0.2), but this metric declines sharply as SCM size grows. This implies that larger models may disproportionately affect fairness metrics.
- **Accuracy (AUC)**: Larger SCM sizes (x ≈ 100–200) correlate with higher accuracy (y ≈ 0.6–1.0), indicating improved performance with model complexity. However, the spread in AUC values suggests diminishing returns or variability in accuracy gains at very large sizes.
- **Practical Implications**: The separation between DSP and AUC highlights a potential conflict between fairness and performance. Optimizing for accuracy in larger models may come at the cost of reduced statistical parity, necessitating careful balancing in applications where both metrics are critical.