\n
## Diagram: Generative Model
### Overview
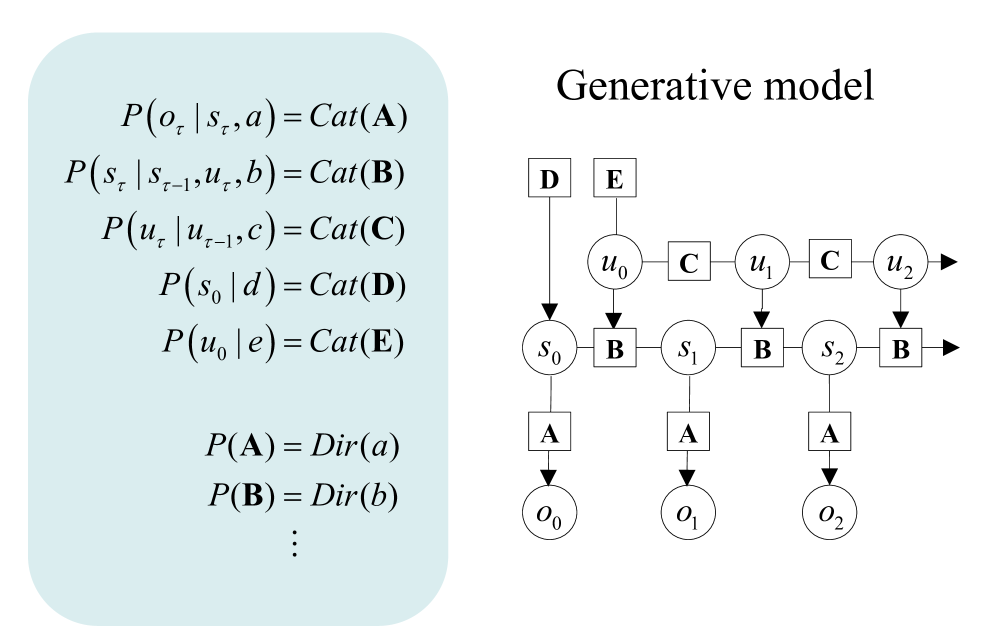
The image presents a diagram illustrating a generative model, likely a recurrent neural network or a similar probabilistic model. The diagram is accompanied by a set of equations defining the probabilistic relationships within the model. The diagram is positioned on the right side of the image, while the equations are on the left, set against a light blue background.
### Components/Axes
The diagram consists of several components:
* **Nodes:** Represented by circles, labeled `u0`, `u1`, `u2`, `s0`, `s1`, `s2`, `o0`, `o1`, `o2`.
* **Variables:** Represented by letters `A`, `B`, `C`, `D`, `E`, `a`, `b`.
* **Arrows:** Indicate the flow of information or dependencies between nodes.
* **Labels:** The diagram is titled "Generative model".
* **Equations:** A series of probabilistic equations are listed on the left side.
### Detailed Analysis or Content Details
The equations define the following probabilistic relationships:
* `P(oτ | sτ, a) = Cat(A)`
* `P(sτ | sτ-1, uτ, b) = Cat(B)`
* `P(uτ | uτ-1, c) = Cat(C)`
* `P(s0 | d) = Cat(D)`
* `P(u0 | e) = Cat(E)`
* `P(A) = Dir(a)`
* `P(B) = Dir(b)`
* `...` (indicated by ellipsis, suggesting more similar equations exist)
The diagram shows a sequence of nodes connected by arrows. The flow is generally from left to right.
* `o0`, `o1`, `o2` are at the bottom, connected to `s0`, `s1`, `s2` respectively.
* `s0`, `s1`, `s2` are connected to `u0`, `u1`, `u2` respectively.
* `u0`, `u1`, `u2` are connected to nodes labeled `C`.
* The nodes `A`, `B`, `C`, `D`, `E` are positioned above the corresponding nodes in the flow.
### Key Observations
* The equations use the notation `Cat(X)` which likely represents a Categorical distribution with parameter `X`.
* The equations use the notation `Dir(X)` which likely represents a Dirichlet distribution with parameter `X`.
* The subscript `τ` in the equations likely represents a time step.
* The ellipsis in the equations suggests a potentially infinite sequence of similar probabilistic relationships.
* The diagram visually represents a recurrent structure, where the output at one time step influences the input at the next.
### Interpretation
The diagram and equations describe a generative model that produces a sequence of observations (`oτ`). The model uses hidden states (`sτ`) and latent variables (`uτ`) to generate these observations. The parameters of the model (`A`, `B`, `C`, `D`, `E`) are themselves drawn from Dirichlet distributions (`Dir(a)`, `Dir(b)`). This suggests a hierarchical Bayesian model where the model learns the parameters from the data.
The model can be interpreted as a probabilistic sequence model, similar to a Hidden Markov Model (HMM) or a Recurrent Neural Network (RNN). The `Cat` distributions represent the probability of transitioning between states or emitting observations. The `Dir` distributions act as priors on the parameters of the model, allowing for uncertainty and regularization.
The diagram's structure suggests that the model is capable of generating sequences of arbitrary length, as the recurrent connections allow information to flow from one time step to the next. The model's generative nature implies that it can be used to sample new sequences that are similar to the training data.