## Heatmap: Bridge Node Appearance Over Early Iterations (Sorted by First Appearance)
### Overview
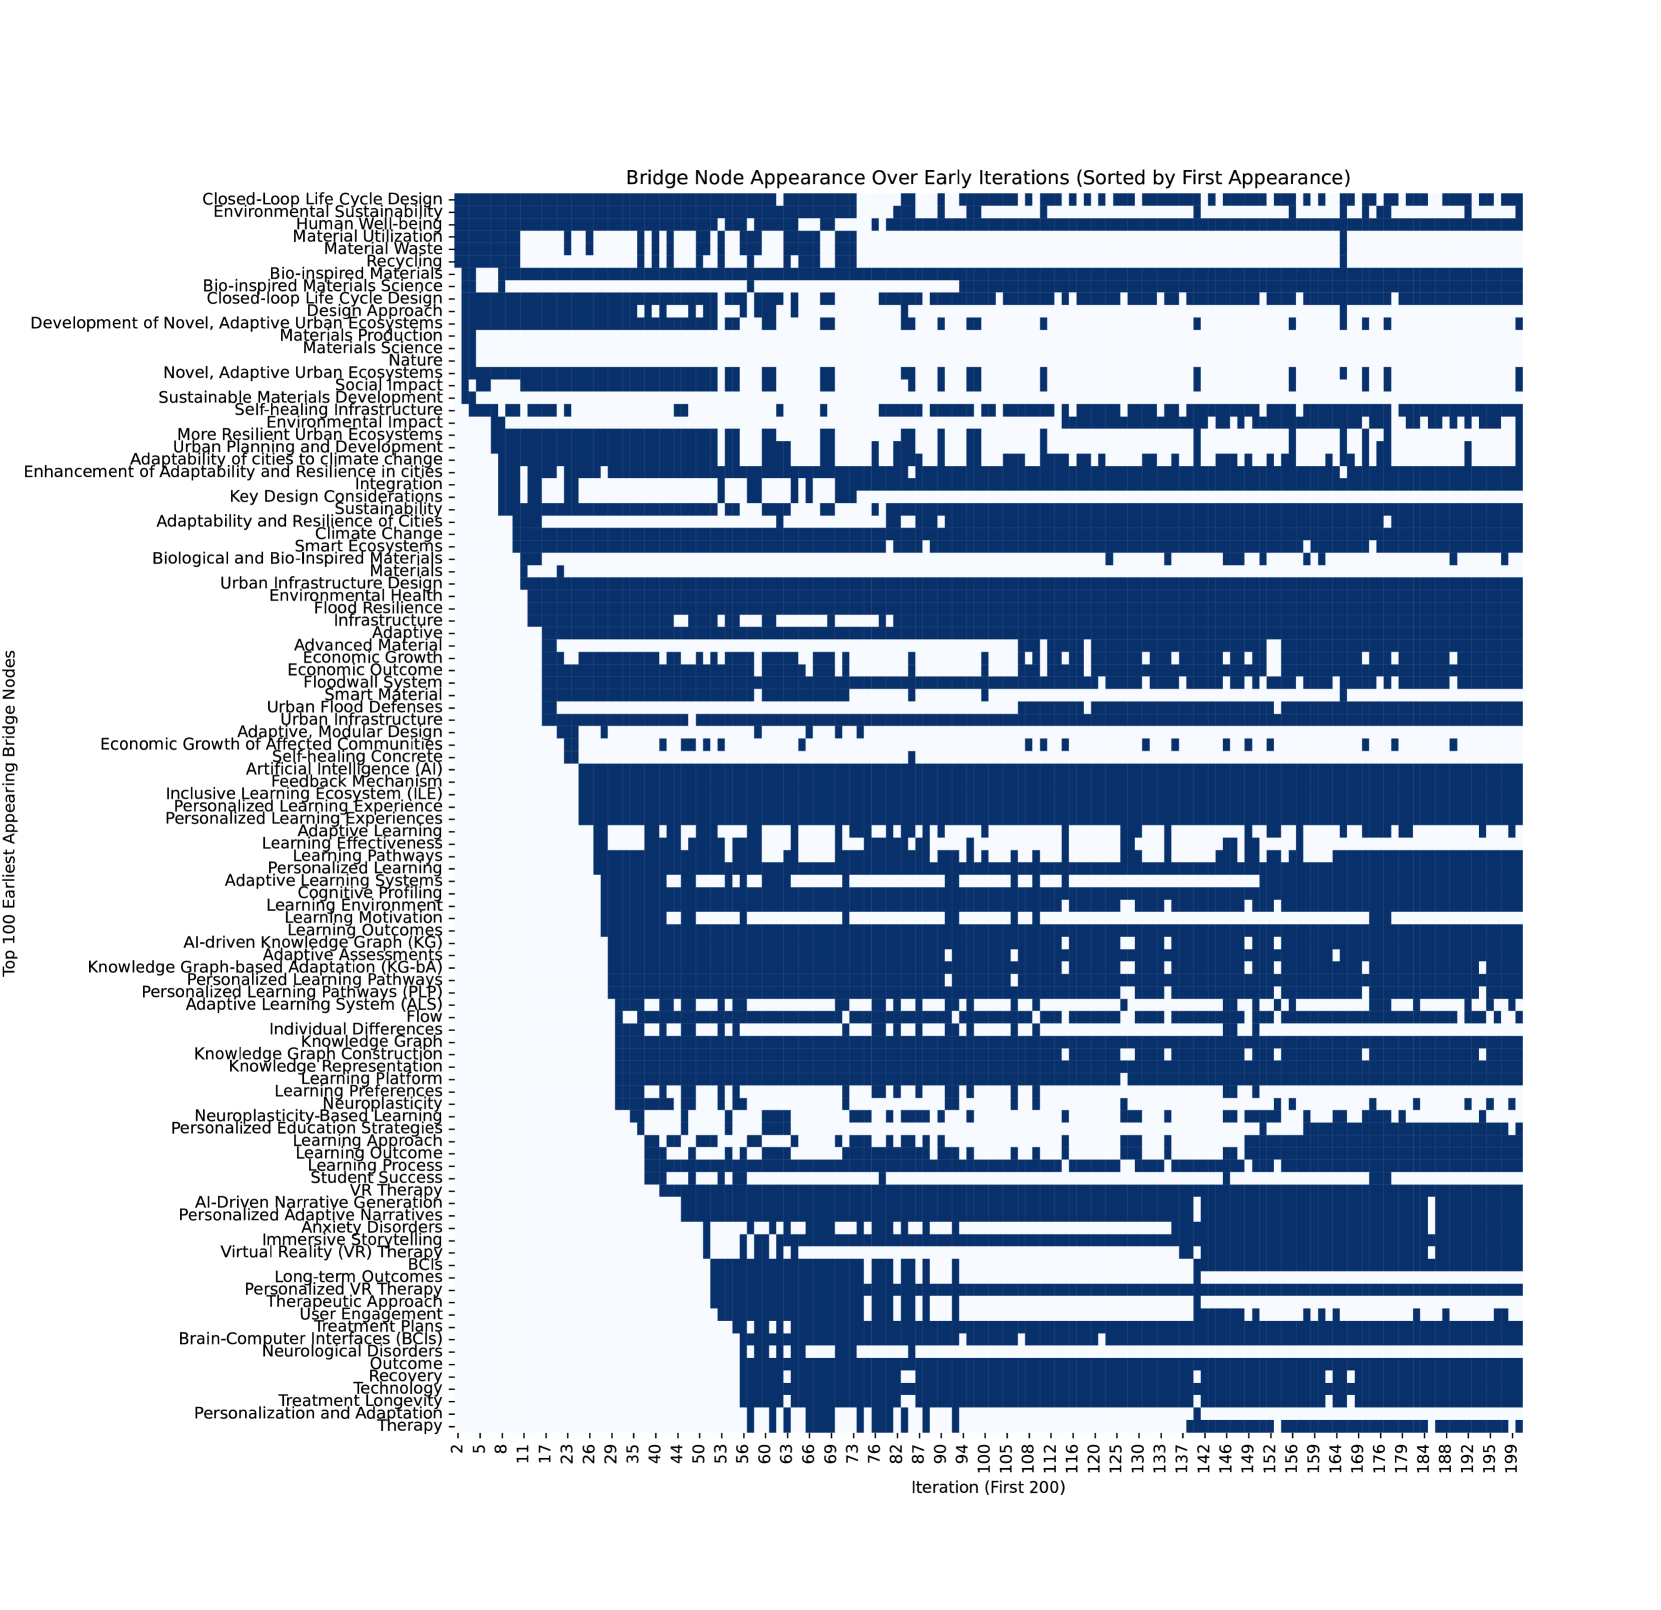
The image is a heatmap visualizing the appearance of bridge nodes over the first 200 iterations. The y-axis lists the top 100 earliest appearing bridge nodes, and the x-axis represents the iteration number. Dark blue cells indicate the presence of a specific bridge node at a given iteration. The nodes are sorted by their first appearance.
### Components/Axes
* **Title:** Bridge Node Appearance Over Early Iterations (Sorted by First Appearance)
* **X-axis:** Iteration (First 200). The x-axis is labeled with iteration numbers from 2 to 199, with increments varying. Specific values include: 2, 5, 8, 11, 17, 23, 26, 29, 35, 40, 44, 50, 53, 56, 60, 63, 66, 69, 73, 76, 82, 87, 90, 94, 100, 105, 108, 112, 116, 120, 125, 130, 133, 137, 142, 146, 149, 152, 156, 159, 164, 169, 176, 179, 184, 188, 192, 195, 199.
* **Y-axis:** Top 100 Earliest Appearing Bridge Nodes. The y-axis lists the following bridge nodes:
* Closed-Loop Life Cycle Design
* Environmental Sustainability
* Human Well-being
* Material Utilization
* Material Waste
* Recycling
* Bio-inspired Materials
* Bio-inspired Materials Science
* Closed-loop Life Cycle Design
* Design Approach
* Development of Novel, Adaptive Urban Ecosystems
* Materials Production
* Materials Science
* Nature
* Novel, Adaptive Urban Ecosystems
* Social Impact
* Sustainable Materials Development
* Self-healing Infrastructure
* Environmental Impact
* More Resilient Urban Ecosystems
* Urban Planning and Development
* Adaptability of cities to climate change
* Enhancement of Adaptability and Resilience in cities
* Integration
* Key Design Considerations
* Sustainability
* Adaptability and Resilience of Cities
* Climate Change
* Smart Ecosystems
* Biological and Bio-Inspired Materials
* Materials
* Urban Infrastructure Design
* Environmental Health
* Flood Resilience
* Infrastructure
* Adaptive
* Advanced Material
* Economic Growth
* Economic Outcome
* Floodwall System
* Smart Material
* Urban Flood Defenses
* Urban Infrastructure
* Adaptive, Modular Design
* Economic Growth of Affected Communities
* Self-healing Concrete
* Artificial Intelligence (AI)
* Feedback Mechanism
* Inclusive Learning Ecosystem (ILE)
* Personalized Learning Experience
* Personalized Learning Experiences
* Adaptive Learning
* Learning Effectiveness
* Learning Pathways
* Adaptive Learning Systems
* Cognitive Profiling
* Learning Environment
* Learning Motivation
* Learning Outcomes
* AI-driven Knowledge Graph (KG)
* Adaptive Assessments
* Knowledge Graph-based Adaptation (KG-BA)
* Personalized Learning Pathways
* Personalized Learning Pathways (PLP)
* Adaptive Learning System (ALS)
* Flow
* Individual Differences
* Knowledge Graph
* Knowledge Graph Construction
* Knowledge Representation
* Learning Platform
* Learning Preferences
* Neuroplasticity
* Neuroplasticity-Based Learning
* Personalized Education Strategies
* Learning Approach
* Learning Outcome
* Learning Process
* Student Success
* VR Therapy
* AI-Driven Narrative Generation
* Personalized Adaptive Narratives
* Anxiety Disorders
* Immersive Storytelling
* Virtual Reality (VR) Therapy
* BCIs
* Long-term Outcomes
* Personalized VR Therapy
* Therapeutic Approach
* User Engagement
* Treatment Plans
* Brain-Computer Interfaces (BCIs)
* Neurological Disorders
* Outcome
* Recovery
* Technology
* Treatment Longevity
* Personalization and Adaptation Therapy
* **Color Scheme:** Dark blue indicates the presence of a bridge node at a specific iteration; white indicates absence.
### Detailed Analysis
The heatmap shows a clear trend:
* Nodes at the top of the list (e.g., "Closed-Loop Life Cycle Design," "Environmental Sustainability") appear consistently throughout the early iterations.
* As you move down the list, nodes appear later and less frequently.
* Some nodes, like "Personalization and Adaptation Therapy," only appear sporadically in the later iterations.
### Key Observations
* The heatmap visually confirms that the nodes are sorted by their first appearance.
* There is a wide variation in the persistence of different bridge nodes across iterations. Some nodes are consistently present, while others are only briefly active.
* The density of dark blue cells decreases as you move from left to right and from top to bottom, indicating that fewer nodes are active in later iterations and that the later-appearing nodes are less consistently present.
### Interpretation
The heatmap provides insights into the evolution of bridge node activity over the first 200 iterations. The nodes at the top, which appear early and consistently, likely represent fundamental or foundational concepts. The nodes that appear later and less frequently may represent more specialized or derivative concepts that build upon the earlier ones. The visualization suggests a hierarchical structure where some concepts are consistently relevant, while others become important only in specific contexts or later stages of development. The data suggests that the initial iterations are dominated by a core set of concepts, and as the process evolves, new and more specialized concepts emerge.