## Heatmap: Bridge Node Appearance Over Early Iterations
### Overview
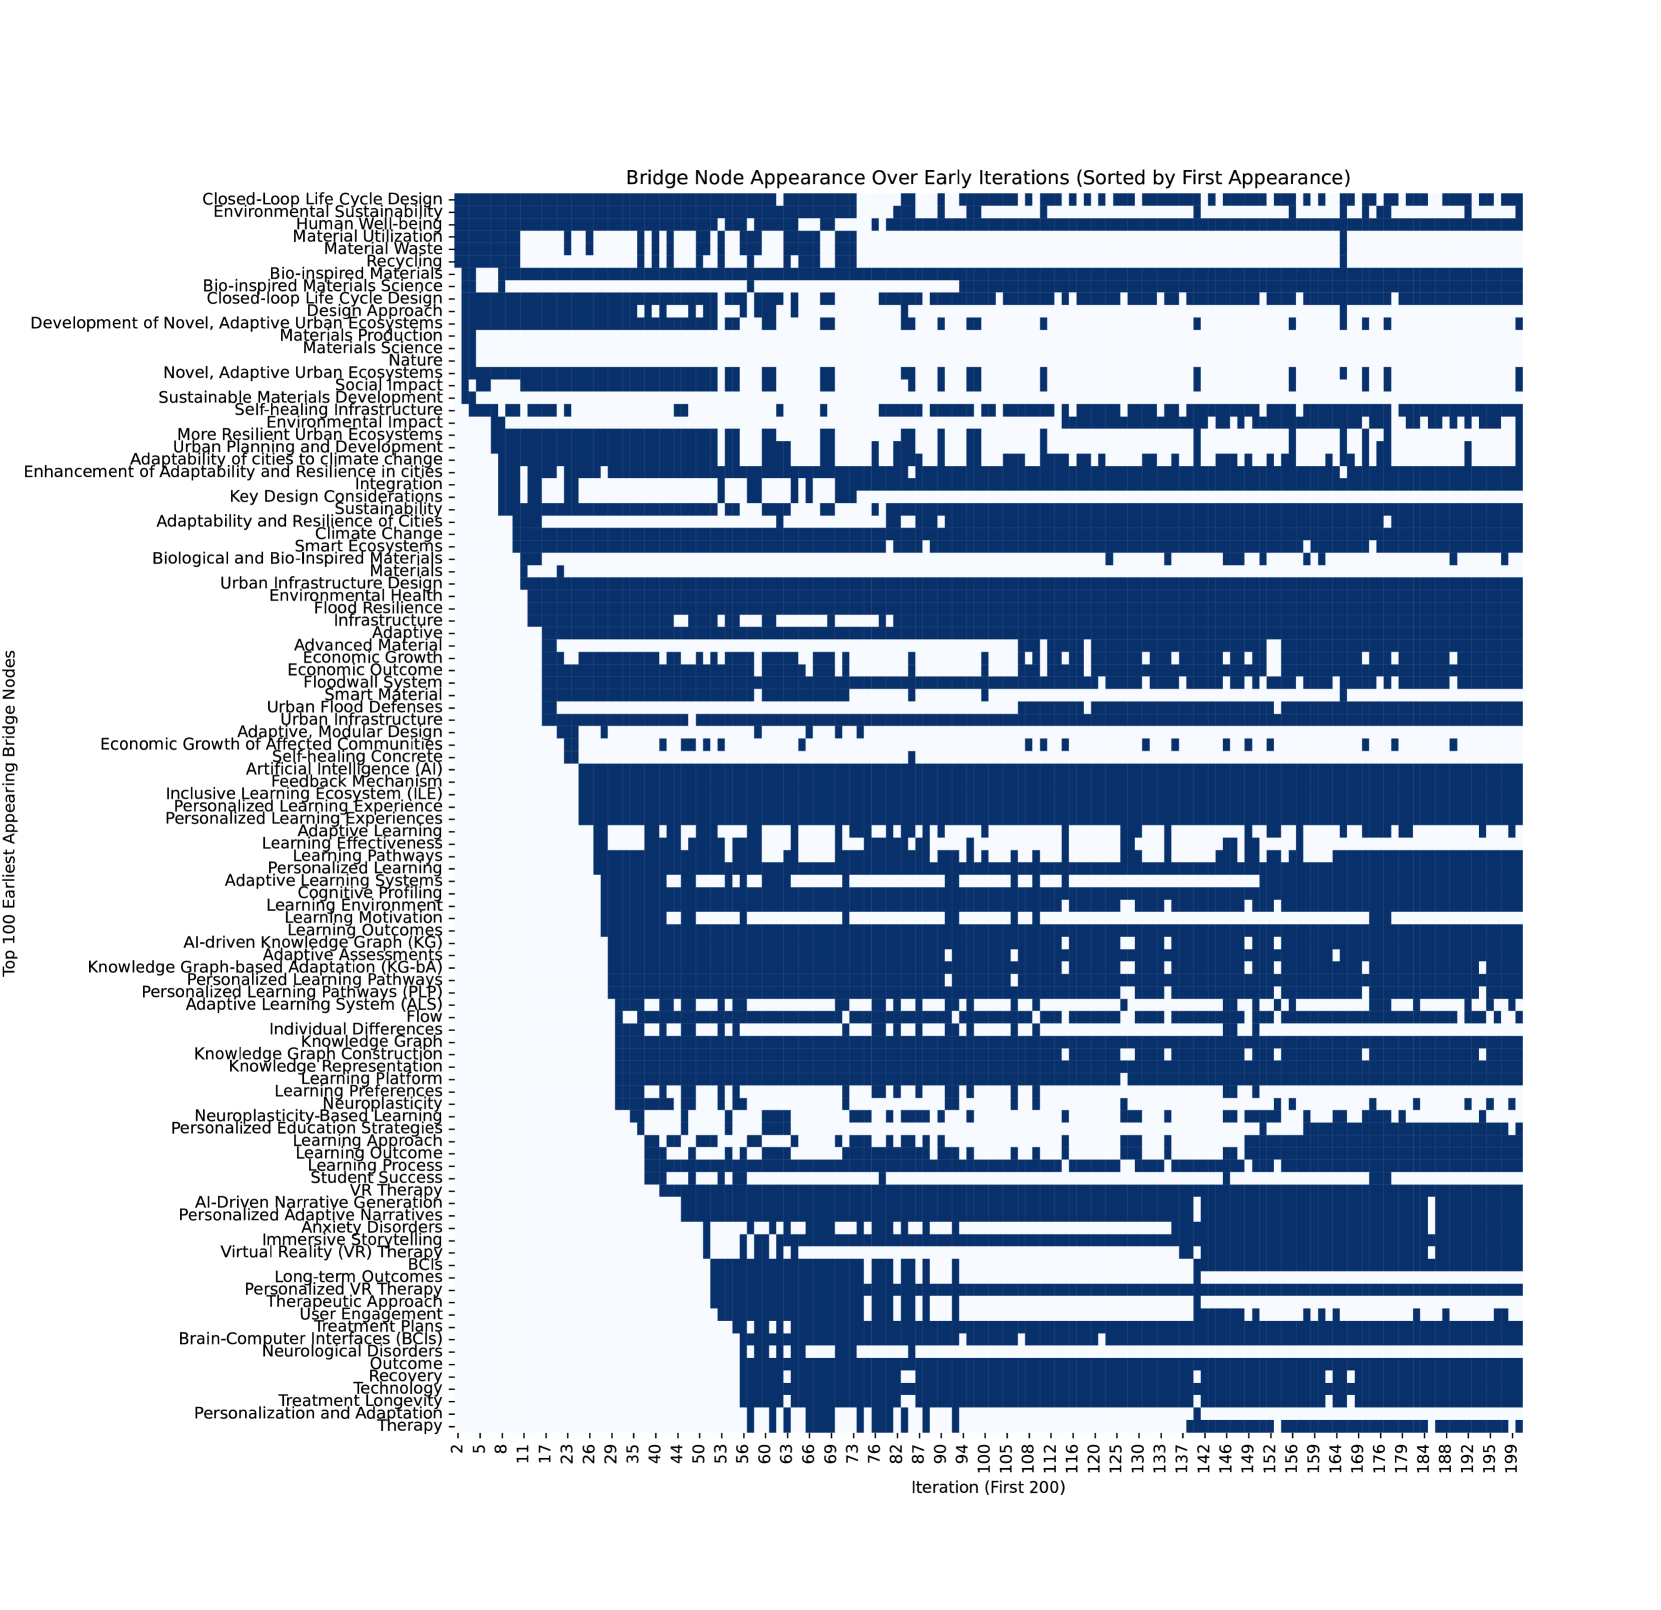
This image is a binary heatmap visualizing the presence or absence of 100 specific "Bridge Nodes" (concepts or topics) across 200 iterations. The chart is sorted by the iteration in which each node first appears, resulting in a distinct "staircase" or triangular distribution pattern. Dark blue cells indicate the presence of a node in a specific iteration, while white cells indicate absence.
### Components/Axes
* **Title:** "Bridge Node Appearance Over Early Iterations (Sorted by First Appearance)"
* **Y-Axis (Left):** A list of 100 unique "Bridge Nodes," representing concepts or research topics. The axis is labeled "Top 100 Earliest Appearing Bridge Nodes."
* **X-Axis (Bottom):** Iteration numbers ranging from 2 to 199. The axis is labeled "Iteration (First 200)."
* **Legend/Encoding:**
* **Dark Blue:** Node is present/active in that iteration.
* **White:** Node is absent/inactive in that iteration.
### Detailed Analysis
The data is organized as a matrix where the Y-axis represents the nodes and the X-axis represents the iterations. The nodes are sorted by their first appearance, creating a diagonal trend from the top-left to the bottom-right.
**List of Bridge Nodes (Y-Axis, Top to Bottom):**
1. Closed-Loop Life Cycle Design
2. Environmental Sustainability
3. Human Well-being
4. Material Utilization
5. Material Waste
6. Recycling
7. Bio-inspired Materials
8. Materials Production
9. Closed-loop Life Cycle Design
10. Design Approach
11. Development of Novel, Adaptive Urban Ecosystems
12. Materials Science
13. Nature
14. Novel, Adaptive Urban Ecosystems
15. Social Impact
16. Sustainable Materials Development
17. Self-healing Infrastructure
18. Environmental Impact
19. More Resilient Urban Ecosystems
20. Urban Planning and Development
21. Adaptability of cities to climate change
22. Enhancement of Adaptability and Resilience in cities
23. Integration
24. Key Design Considerations
25. Sustainability
26. Adaptability and Resilience
27. Climate Change
28. Smart Ecosystems
29. Biological and Bio-Inspired Materials
30. Urban Infrastructure Design
31. Environmental Health
32. Flood Resilience
33. Infrastructure
34. Adaptive
35. Advanced Material
36. Economic Growth
37. Economic Outcome
38. Floodwall System
39. Smart Material
40. Urban Flood Defenses
41. Urban Infrastructure
42. Adaptive, Modular Design
43. Economic Growth of Affected Communities
44. Artificial Intelligence (AI)
45. Feedback Mechanism
46. Inclusive Learning Ecosystem (ILE)
47. Learning Pathways
48. Personalized Learning Experiences
49. Adaptive Learning
50. Learning Effectiveness
51. Learning Environment
52. Personalized Learning
53. Adaptive Learning Systems
54. Cognitive Profiling
55. Learning Approach
56. Learning Motivation
57. Learning Outcomes
58. AI-driven Knowledge Graph (KG)
59. Knowledge Graph-based Adaptation (KG-bA)
60. Personalized Learning Pathways
61. Adaptive Learning System (ALS)
62. Flow
63. Individual Differences
64. Knowledge Graph Construction
65. Knowledge Representation
66. Learning Platform
67. Learning Preferences
68. Neuroplasticity
69. Neuroplasticity-Based Learning
70. Personalized Education Strategies
71. Learning Approach
72. Learning Outcome
73. Learning Process
74. Student Success
75. AI-Driven Narrative Generation
76. Personalized Adaptive Narratives
77. Learning Disorders
78. Immersive Storytelling
79. Virtual Reality (VR) Therapy
80. BCIs
81. Long-term Outcomes
82. Personalized VR Therapy
83. Therapeutic Approach
84. User Engagement
85. Treatment
86. Brain-Computer Interfaces (BCIs)
87. Neurological Disorders
88. Outcome
89. Recovery
90. Technology
91. Treatment Longevity
92. Personalization and Adaptation
93. Therapy
*(Note: The list contains 93 distinct lines visible in the chart, though the axis label indicates "Top 100". Some labels appear to be duplicates or variations of previous entries.)*
### Key Observations
* **Evolutionary Pattern:** The "staircase" effect confirms that the system or research process being tracked is cumulative. Once a node appears, it tends to persist, though some nodes show intermittent activity (gaps in the blue lines).
* **Thematic Clustering:** The nodes appear in thematic blocks:
* **Early Iterations (Top):** Focus on sustainability, urban planning, and materials science (e.g., "Recycling," "Flood Resilience," "Urban Infrastructure").
* **Middle Iterations (Center):** A distinct shift toward AI and Education (e.g., "Artificial Intelligence," "Personalized Learning," "Knowledge Graph").
* **Later Iterations (Bottom):** A shift toward medical/therapeutic applications (e.g., "Neuroplasticity," "VR Therapy," "Neurological Disorders").
* **Persistence:** Many nodes, once introduced, remain active for the duration of the 200 iterations (solid horizontal blue lines), suggesting they are foundational concepts.
### Interpretation
This heatmap likely visualizes the **evolution of a generative design process, a literature review, or a machine learning model's knowledge base** over time.
* **Thematic Progression:** The data demonstrates a clear conceptual migration. The system begins by addressing physical-world problems (Urban/Environmental/Materials), transitions into the cognitive/digital domain (AI/Learning/Knowledge Graphs), and finally moves into the biological/clinical domain (Neuroplasticity/Therapy/BCIs).
* **Interdisciplinary Nature:** The "Bridge Nodes" likely represent concepts that link these disparate fields. For example, "Adaptive" and "Personalized" appear in both the urban planning phase and the learning/therapy phases, acting as the conceptual "bridges" that allow the system to evolve from one domain to the next.
* **System Maturity:** The increasing density of nodes in the middle iterations suggests a period of rapid conceptual expansion, while the later iterations show a more specialized focus on therapeutic and neurological applications.