\n
## Chart: Bridge Node Appearance Over Early Iterations
### Overview
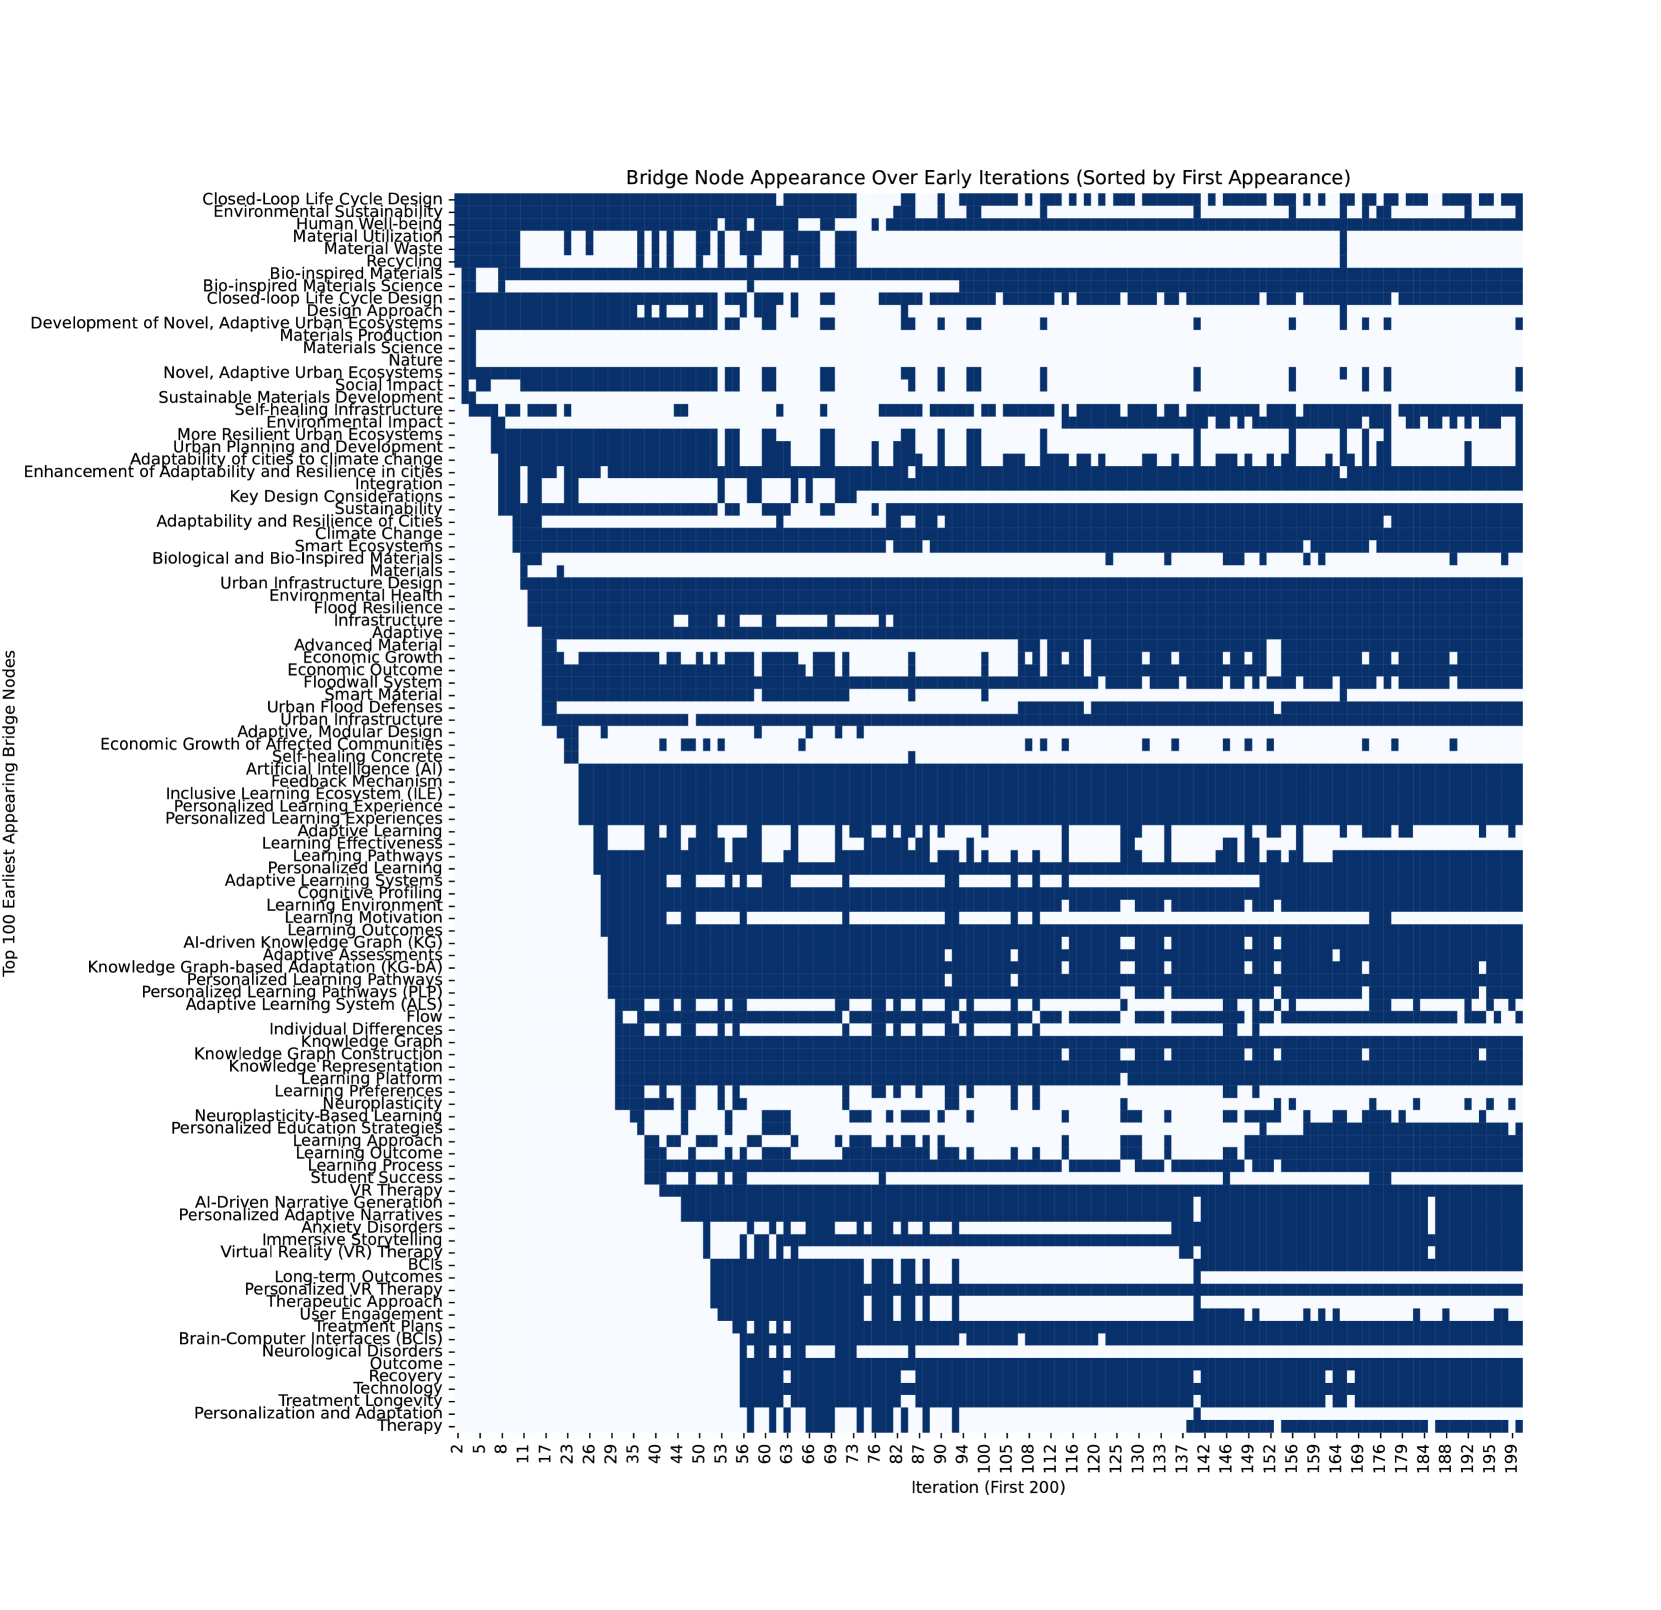
This chart visualizes the appearance of the top 100 earliest appearing bridge nodes across iterations (1 to 200). Each row represents a different bridge node, and the horizontal bars indicate the iterations during which that node was present. The chart is sorted by the first appearance of each node. The x-axis represents the iteration number, and the y-axis lists the bridge nodes.
### Components/Axes
* **X-axis Title:** "Iteration (First 200)" - Scale ranges from approximately 1 to 200.
* **Y-axis Title:** "Top 100 Earliest Appearing Bridge Nodes" - Lists 100 different bridge nodes.
* **Chart Type:** Horizontal bar chart (or a variation of a Gantt chart).
* **Color Scheme:** Black bars represent the presence of a node during specific iterations.
* **Sorting:** Nodes are sorted by their first appearance iteration, ascending from top to bottom.
### Detailed Analysis or Content Details
The chart displays the presence/absence of each bridge node across the first 200 iterations. Here's a breakdown of some key nodes and their appearance patterns (approximations due to visual estimation):
* **Closed-Loop Life Cycle Design:** Appears from iteration ~1 to ~15.
* **Environmental Sustainability:** Appears from iteration ~1 to ~18.
* **Material Utilization:** Appears from iteration ~1 to ~20.
* **Bio-inspired Design:** Appears from iteration ~1 to ~25.
* **Big-inspired Materials:** Appears from iteration ~1 to ~30.
* **Development of Novel, Adaptive Urban Design:** Appears from iteration ~1 to ~35.
* **Sustainable Materials Development:** Appears from iteration ~1 to ~40.
* **More Resilient Infrastructure:** Appears from iteration ~1 to ~45.
* **Adaptability and Resilience of Cities:** Appears from iteration ~1 to ~50.
* **Key Design Considerations:** Appears from iteration ~1 to ~55.
* **Smart Ecosystems:** Appears from iteration ~1 to ~60.
* **Economic Growth:** Appears from iteration ~1 to ~65.
* **Inclusive Learning Experiences:** Appears from iteration ~1 to ~70.
* **Personalized Learning:** Appears from iteration ~1 to ~75.
* **Knowledge Flows:** Appears from iteration ~1 to ~80.
* **AI-Driven Insights:** Appears from iteration ~1 to ~85.
* **Virtuosity:** Appears from iteration ~1 to ~90.
* **Brain-Computer Interfaces:** Appears from iteration ~1 to ~95.
* **Personalization:** Appears from iteration ~1 to ~100.
* **Knowledge Discovery:** Appears from iteration ~1 to ~105.
* **Adaptive Infrastructure:** Appears from iteration ~1 to ~110.
* **Data-Driven Decision Making:** Appears from iteration ~1 to ~115.
* **Algorithmic Governance:** Appears from iteration ~1 to ~120.
* **Knowledge Graphs:** Appears from iteration ~1 to ~125.
* **Learning Motivation:** Appears from iteration ~1 to ~130.
* **Personalized Coaching:** Appears from iteration ~1 to ~135.
* **Learning Effectiveness:** Appears from iteration ~1 to ~140.
* **Adaptive Learning Systems:** Appears from iteration ~1 to ~145.
* **Urban Informatics:** Appears from iteration ~1 to ~150.
* **Urban Infrastructure:** Appears from iteration ~1 to ~155.
* **Advanced Materials:** Appears from iteration ~1 to ~160.
* **Economic Resilience:** Appears from iteration ~1 to ~165.
* **Biomimicry:** Appears from iteration ~1 to ~170.
* **Biological and Bio-inspired Materials:** Appears from iteration ~1 to ~175.
* **Urban Microstructures:** Appears from iteration ~1 to ~180.
* **Resilient Materials:** Appears from iteration ~1 to ~185.
* **Environmental Impact Assessment:** Appears from iteration ~1 to ~190.
* **Urban Planning and Development:** Appears from iteration ~1 to ~195.
* **Enhancement of Urban Ecosystem Services:** Appears from iteration ~1 to ~200.
Many nodes appear early and persist for a relatively short duration (e.g., less than 50 iterations). Some nodes have longer durations, extending closer to iteration 200.
### Key Observations
* A significant number of nodes appear very early in the process (iterations 1-20).
* The duration of node presence varies considerably.
* There's a general trend of nodes appearing and then disappearing, suggesting a dynamic evolution of concepts.
* The chart provides a visual representation of the "burstiness" of concept emergence.
### Interpretation
This chart illustrates the evolution of ideas within the early stages of a project or research endeavor. The early appearance and relatively short duration of many nodes suggest a period of rapid exploration and experimentation. The sorting by first appearance highlights the initial conceptual foundations upon which subsequent ideas build. The varying durations of node presence indicate that some concepts are quickly discarded or integrated into others, while others remain relevant for a longer period.
The chart suggests a process of iterative refinement, where initial ideas are tested, modified, or replaced as the project progresses. The "burstiness" of concept emergence implies that ideas are not necessarily introduced linearly but rather in waves of innovation. The chart could be used to identify key foundational concepts (those appearing earliest and persisting longest) and to track the evolution of specific ideas over time. It provides a valuable visual summary of the conceptual landscape during the early stages of development. The data suggests a complex, non-linear process of knowledge creation and refinement.