TECHNICAL ASSET FINGERPRINT
b885906247f028f2905d1e36
Click to view fullscreen
Press ESC or click to close
FOUND IN PAPERS
EXPERT: healer-alpha-free VERSION 1
RUNTIME: free/openrouter/healer-alpha
INTEL_VERIFIED
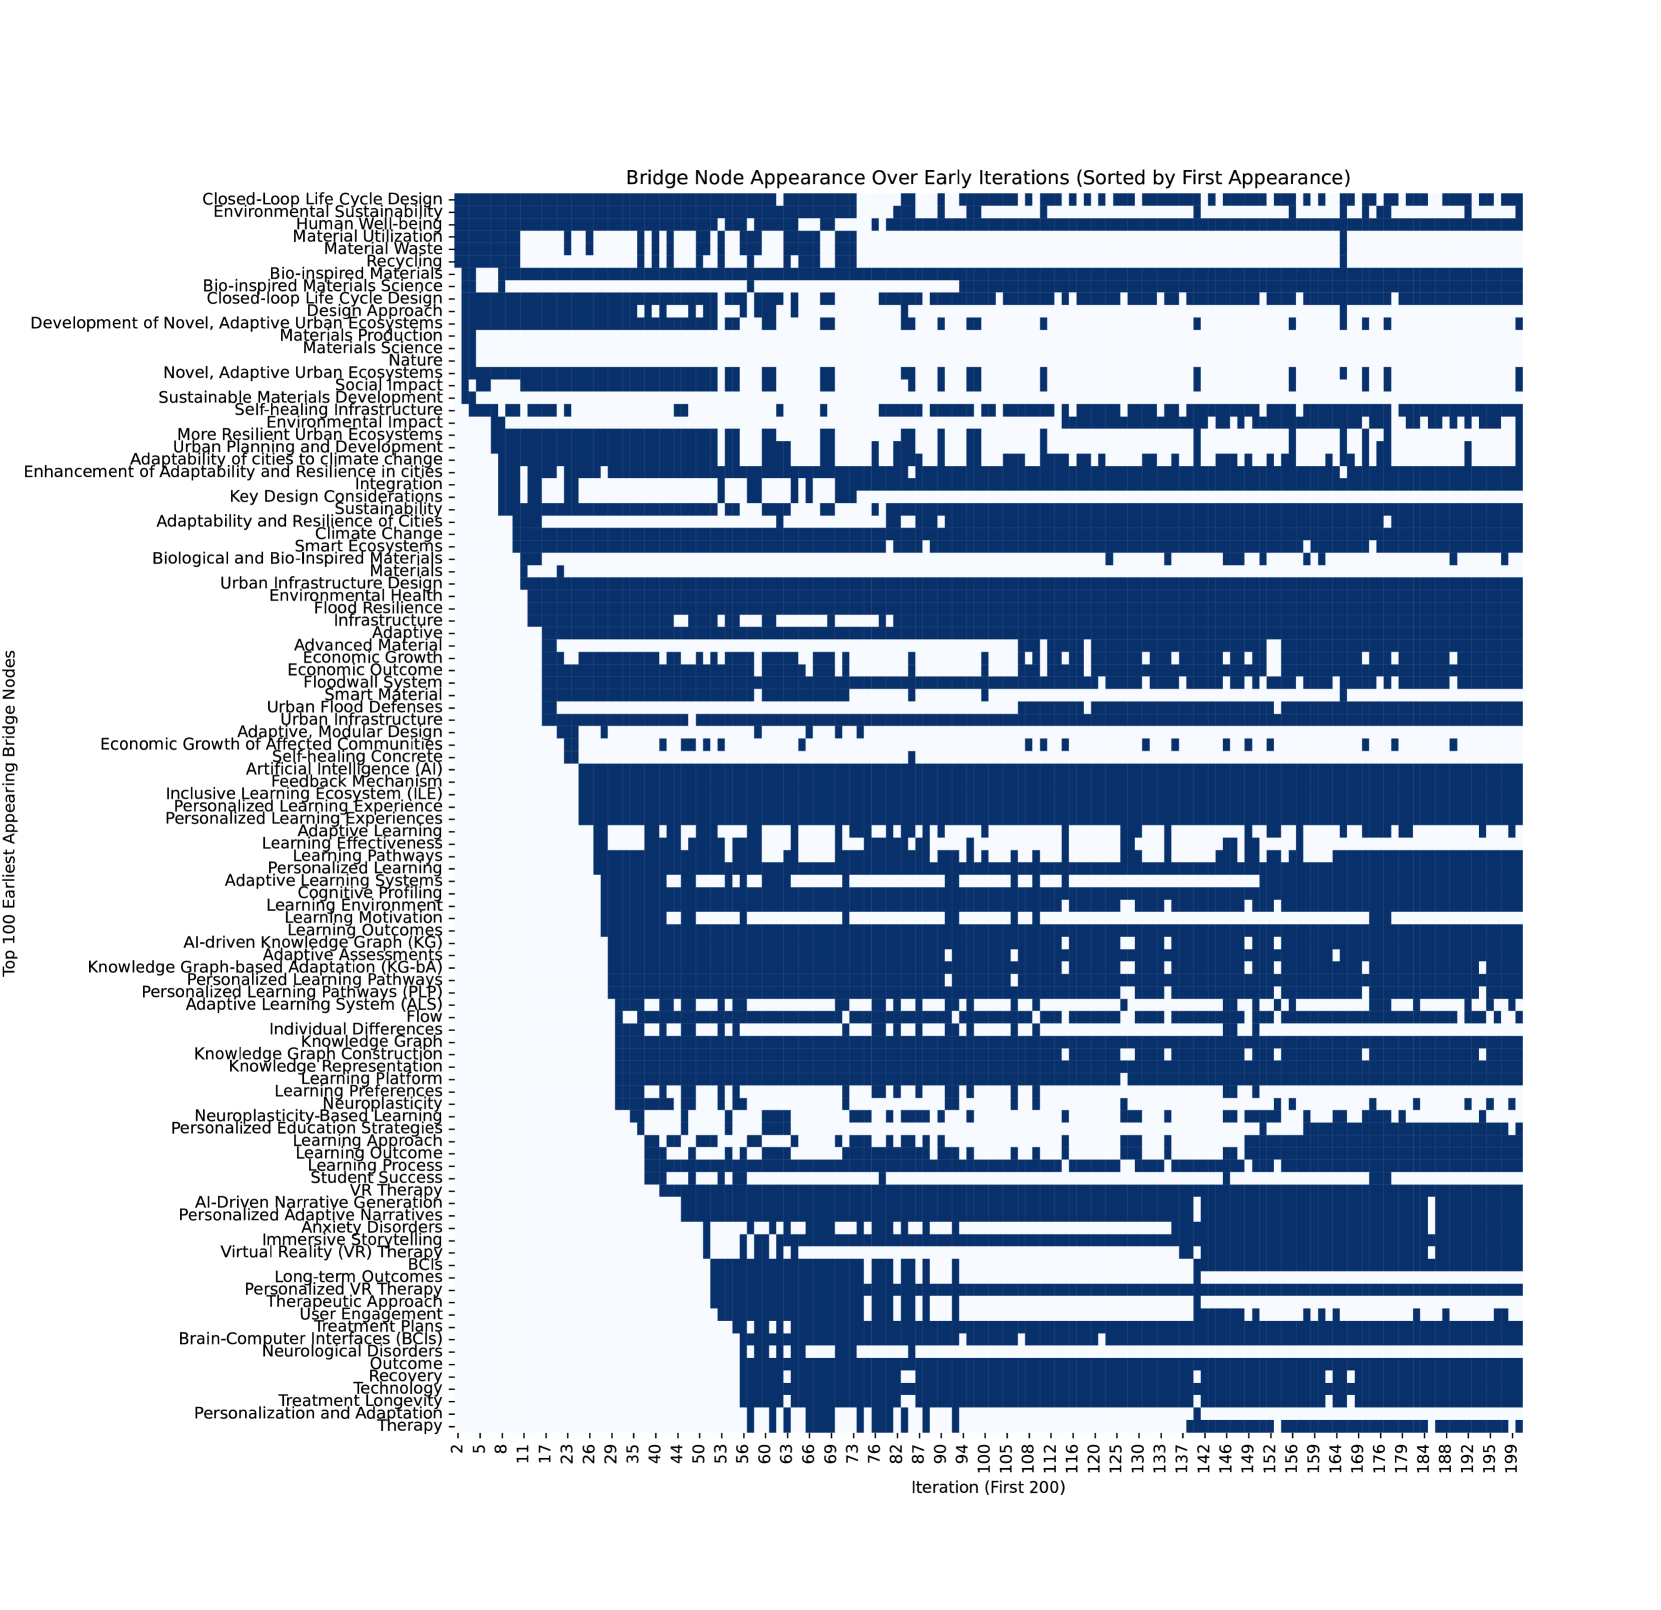
## Heatmap Chart: Bridge Node Appearance Over Early Iterations (Sorted by First Appearance)
### Overview
This image is a binary presence/absence heatmap (or "rug plot") visualizing the appearance of 100 specific "bridge nodes" across the first 200 iterations of a process. The chart is sorted by the first iteration in which each node appears, creating a diagonal cascade pattern from the top-left to the bottom-right. Dark blue indicates the node is present in that iteration; white indicates absence.
### Components/Axes
* **Title:** "Bridge Node Appearance Over Early Iterations (Sorted by First Appearance)"
* **Y-Axis (Vertical):** Labeled "Top 100 Earliest Appearing Bridge Nodes". It lists 100 distinct conceptual nodes, likely from a knowledge graph or conceptual model. The nodes are sorted in descending order of their first appearance iteration.
* **X-Axis (Horizontal):** Labeled "Iteration (First 200)". It represents a sequence of iterations or time steps. The axis markers are numerical, starting at 2 and ending at 199, with labeled ticks at irregular intervals (e.g., 2, 5, 8, 11, 17, 23, 29, 35, 40, 44, 50, 53, 56, 60, 63, 66, 69, 73, 76, 82, 87, 90, 94, 100, 105, 108, 112, 116, 120, 125, 130, 133, 137, 142, 146, 149, 152, 156, 159, 164, 169, 176, 179, 184, 188, 192, 195, 199).
* **Legend/Color Key:** Implicit. A solid dark blue rectangle represents "presence" in an iteration. White represents "absence". There is no separate legend box; the color meaning is inferred from the chart's structure.
### Detailed Analysis
**List of Bridge Nodes (Y-Axis, from top to bottom):**
1. Closed-Loop Life Cycle Design
2. Environmental Sustainability
3. Human Well-being
4. Material Utilization
5. Material Waste
6. Recycling
7. Bio-inspired Materials
8. Bio-inspired Materials Science
9. Closed-loop Life Cycle Design
10. Design Approach
11. Development of Novel, Adaptive Urban Ecosystems
12. Materials
13. Materials Science
14. Nature
15. Novel, Adaptive Urban Ecosystems
16. Social Impact
17. Sustainable Materials Development
18. Self-healing Infrastructure
19. Environmental Impact
20. More Resilient Urban Systems
21. Urban Planning and Development
22. Adaptability of cities to climate change
23. Enhancement of Adaptability and Resilience in cities
24. Integration
25. Key Design Considerations
26. Sustainability
27. Adaptability and Resilience of Cities
28. Climate Change
29. Smart Systems
30. Biological and Bio-Inspired Materials
31. Materials
32. Urban Infrastructure Design
33. Environmental Protection
34. Flood Resilience
35. Infrastructure
36. Adaptive
37. Advanced Materials
38. Economic Impact
39. Economic Outcome
40. Floodwall System
41. Smart Materials
42. Urban Flood Defenses
43. Urban Infrastructure
44. Adaptive, Modular Design
45. Economic Growth of Affected Communities
46. Self-healing Concrete
47. Artificial Intelligence (AI)
48. Feedback Mechanism
49. Inclusive Learning Ecosystem (ILE)
50. Personalized Learning Experience
51. Personalized Learning Environment
52. Adaptive Learning
53. Learning Effectiveness
54. Learning Pathways
55. Personalized Learning
56. Adaptive Learning Systems
57. Cognitive Profiling
58. Learning Environment
59. Learning Motivation
60. Learning Outcomes
61. AI-driven Knowledge Graph (KG)
62. Adaptive Assessments
63. Knowledge Graph-based Adaptation (KG-bA)
64. Personalized Learning Path
65. Personalized Learning Pathways (PLP)
66. Adaptive Learning System (ALS)
67. Flow
68. Individual Differences
69. Knowledge Graph
70. Knowledge Graph Construction
71. Knowledge Representation
72. Learning Analytics
73. Learning Preferences
74. Neuroplasticity
75. Neuroplasticity-Based Learning
76. Personalized Education Strategies
77. Learning Approach
78. Learning Outcome
79. Learning Process
80. Student Success
81. VR
82. AI-Driven Narrative Generation
83. Personalized Adaptive Narratives
84. Anxiety Disorders
85. Immersive Storytelling
86. Virtual Reality (VR) Therapy
87. BCIs
88. Long-term Outcomes
89. Personalized VR Therapy
90. Therapeutic Approach
91. User Engagement
92. Treatment Plans
93. Brain-Computer Interfaces (BCIs)
94. Neurological Disorders
95. Outcome
96. Recovery
97. Technology
98. Treatment Longevity
99. Personalization and Adaptivity
100. Therapy
**Appearance Pattern Analysis:**
* **Trend:** The chart exhibits a strong diagonal trend. Nodes at the top of the list (e.g., "Closed-Loop Life Cycle Design", "Environmental Sustainability") have their first dark blue block at the far left (low iteration numbers, starting at iteration 2). Nodes at the bottom (e.g., "Therapy", "Personalization and Adaptivity") have their first dark blue block much further to the right (higher iteration numbers, appearing after iteration 100).
* **Persistence:** After their first appearance, many nodes show intermittent or continuous presence (solid or broken dark blue lines extending to the right). Some nodes, like "Materials" (#12 and #31) and "Sustainability" (#26), show very high persistence, appearing as nearly solid blue lines across most iterations. Others, like "Anxiety Disorders" (#84) or "VR" (#81), appear only sporadically after their first appearance.
* **Clustering:** There are visible clusters of nodes that first appear around similar iteration ranges, suggesting phases or waves of concept introduction. For example, a large cluster of learning-related nodes (e.g., "Adaptive Learning", "Personalized Learning") appears between iterations ~50-80. Another cluster related to VR and therapy appears after iteration ~100.
### Key Observations
1. **Foundational Concepts:** The earliest-appearing nodes (top of the list) are broad, foundational concepts related to sustainability, materials science, and urban systems (e.g., "Closed-Loop Life Cycle Design", "Environmental Sustainability", "Human Well-being").
2. **Domain Shift:** The list transitions from physical systems (materials, urban infrastructure) to digital and cognitive systems (AI, Knowledge Graphs, Adaptive Learning) and finally to therapeutic applications (VR Therapy, BCIs, Neurological Disorders).
3. **Variable Persistence:** There is no uniform pattern of persistence. Some foundational concepts remain consistently present, while more specialized or applied concepts appear and disappear.
4. **Data Density:** The heatmap is dense, indicating that most of the 100 tracked nodes are active in a significant portion of the first 200 iterations. The white spaces (absences) become more common for nodes lower on the list, particularly in the early iterations before they first appear.
### Interpretation
This chart likely visualizes the evolution of a complex knowledge graph or conceptual model during an iterative generative or learning process (e.g., an AI system building a knowledge base, a simulation evolving, or a research field developing).
* **What it demonstrates:** It shows the **temporal emergence and consolidation of concepts**. Foundational, high-level ideas are established first and tend to persist. More specific, derivative, or application-oriented concepts emerge later as the system or field matures. The intermittent appearance of some nodes suggests they are context-dependent or activated only under certain conditions within the process.
* **Relationships:** The sorting by first appearance implicitly maps a **hierarchy of conceptual dependency or generality**. The diagonal pattern is a direct visual representation of this temporal hierarchy. The clustering of similar nodes (e.g., all the "Adaptive Learning" variants) indicates the development of coherent sub-domains within the broader model.
* **Notable Anomalies/Patterns:**
* The duplicate entry for "Closed-loop Life Cycle Design" (items #1 and #9) and "Materials" (#12 and #31) may indicate a data artifact or the existence of conceptually similar but distinct nodes in the underlying graph.
* The very late and sparse appearance of highly specific terms like "Anxiety Disorders" (#84) suggests they are niche applications that only become relevant after a substantial foundational framework (VR, Therapy, Personalization) is in place.
* The chart's structure allows one to infer the **"conceptual distance"** between nodes. Nodes that appear close together vertically and have similar persistence patterns are likely more closely related in the model's ontology than nodes far apart vertically.
DECODING INTELLIGENCE...