## Heatmap: Bridge Node Appearance Over Early Iterations (Sorted by First Appearance)
### Overview
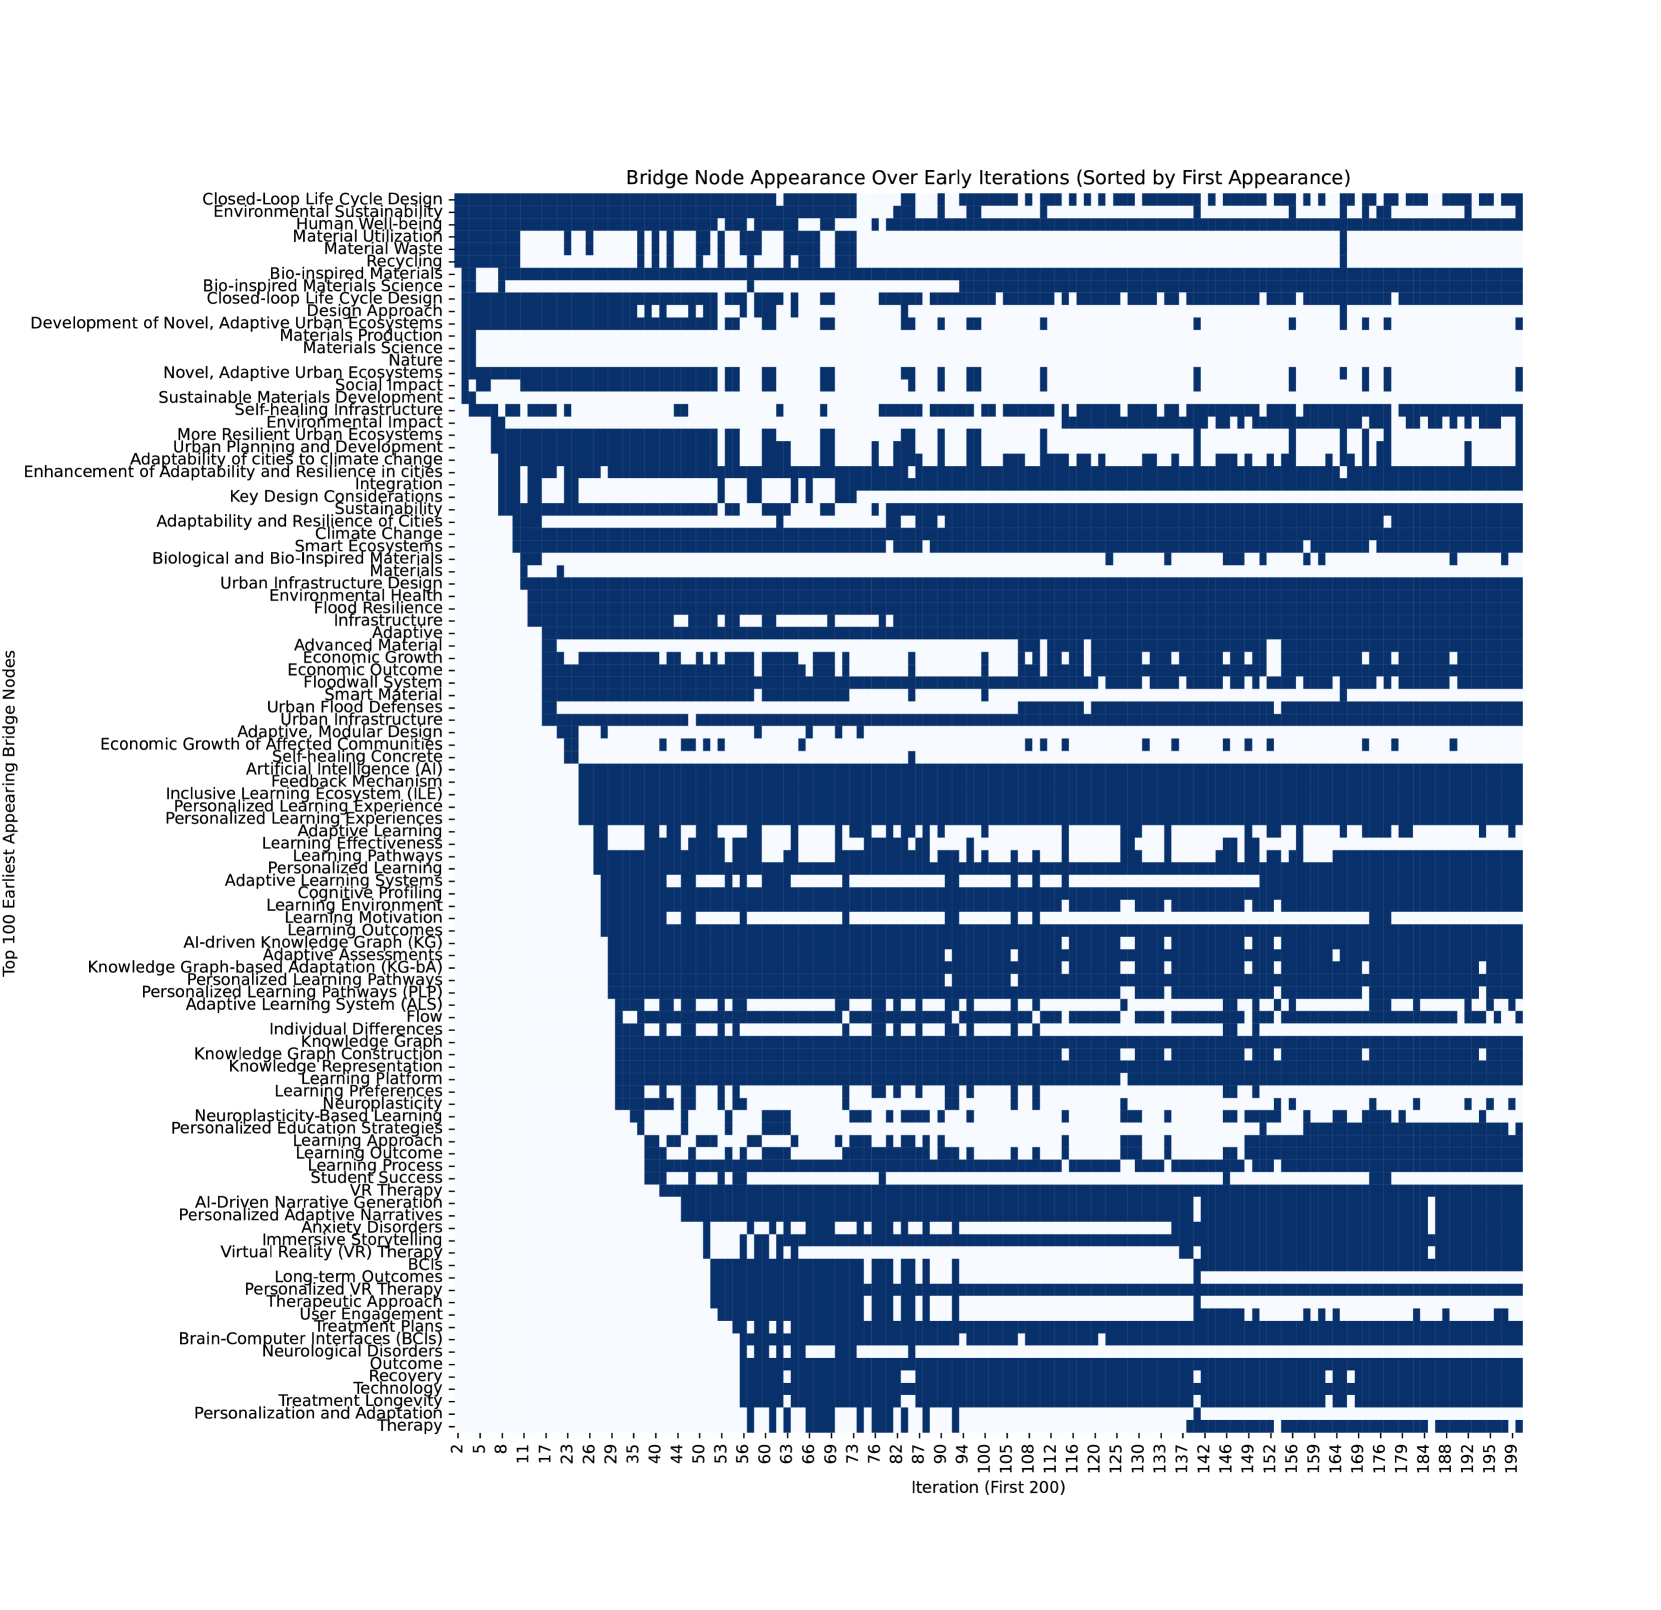
The image is a heatmap visualizing the appearance frequency of 100 bridge node categories across the first 200 iterations of a system. Categories are sorted by their first appearance, with darker blue squares indicating higher frequency or presence in specific iterations. The x-axis represents iterations (2–199), and the y-axis lists categories in order of their initial emergence.
---
### Components/Axes
- **X-Axis**: "Iteration (First 200)" – Labeled with numerical values from 2 to 199, spaced unevenly (e.g., 2, 5, 10, 20, ..., 199).
- **Y-Axis**: 100 categories sorted by first appearance, including:
- Sustainability (e.g., "Closed-Loop Life Cycle Design," "Environmental Sustainability")
- Urban Design (e.g., "Adaptive Urban Ecosystems," "Smart Material")
- Learning Systems (e.g., "Adaptive Learning," "Personalized Learning Pathways")
- Other domains (e.g., "Neurological Disorders," "VR Therapy").
- **Color Coding**: Dark blue squares represent data points; no explicit legend is present, but intensity likely correlates with frequency or presence.
---
### Detailed Analysis
1. **Early Iterations (2–50)**:
- **Dominant Categories**:
- "Closed-Loop Life Cycle Design" (dense block: 2–10).
- "Environmental Sustainability" (dense block: 11–20).
- "Material Utilization" (dense block: 15–25).
- **Sparse Activity**: Most categories appear infrequently, with only a few nodes (e.g., "Recycling," "Bio-inspired Materials") showing sporadic presence.
2. **Mid-Iterations (50–100)**:
- **Emerging Trends**:
- "Adaptive Urban Ecosystems" (dense block: 50–70).
- "Sustainable Materials Development" (dense block: 60–80).
- "Learning Effectiveness" (dense block: 70–90).
- **Overlap**: Categories like "Urban Planning" and "Climate Change" show moderate density (e.g., 55–85).
3. **Late Iterations (100–199)**:
- **High-Frequency Categories**:
- "Personalized Learning Pathways" (dense block: 100–120).
- "Adaptive Learning Systems" (dense block: 110–130).
- "Neurological Disorders" (dense block: 120–140).
- **Late Appearances**:
- "VR Therapy" (first appears at 150, dense block: 150–170).
- "Brain-Computer Interfaces" (first appears at 160, dense block: 160–180).
---
### Key Observations
- **Early Prioritization**: Sustainability and material-related categories dominate the first 20–30 iterations.
- **Mid-Transition**: Urban design and learning systems gain traction between 50–100 iterations.
- **Late Specialization**: Personalized and adaptive systems (e.g., "VR Therapy," "Neurological Disorders") emerge prominently after 100 iterations.
- **Sparse Nodes**: Categories like "Flood Defenses" and "Anxiety Disorders" appear only sporadically or not at all.
---
### Interpretation
The heatmap suggests a phased development strategy:
1. **Foundational Focus**: Early iterations prioritize environmental and material sustainability, reflecting a systems-level approach to resource management.
2. **Mid-Shift**: Urban adaptability and learning systems emerge, indicating a pivot toward human-centric and dynamic environments.
3. **Late-Stage Specialization**: Personalized and adaptive technologies (e.g., VR, BCI) dominate later iterations, suggesting a focus on individualized solutions.
Notably, the absence of certain categories (e.g., "Flood Defenses") in early iterations may indicate delayed prioritization or integration challenges. The sorting by first appearance implies a deliberate sequencing of node development, possibly aligned with iterative system goals.