## Diagram: Causal Diagram of Admission in College
### Overview
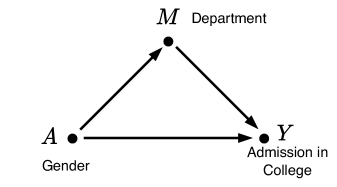
The image is a causal diagram illustrating the relationships between three variables: Gender (A), Department (M), and Admission in College (Y). The diagram uses arrows to indicate the direction of influence between these variables.
### Components/Axes
* **Nodes:**
* A: Gender (located on the bottom-left)
* M: Department (located on the top)
* Y: Admission in College (located on the bottom-right)
* **Arrows:**
* A -> M: Arrow from Gender to Department
* A -> Y: Arrow from Gender to Admission in College
* M -> Y: Arrow from Department to Admission in College
### Detailed Analysis
The diagram shows the following relationships:
* Gender (A) influences the Department (M).
* Gender (A) directly influences Admission in College (Y).
* Department (M) influences Admission in College (Y).
### Key Observations
The diagram suggests that Gender can influence Admission in College both directly and indirectly through the choice of Department.
### Interpretation
The diagram represents a causal model where Gender (A) has a direct effect on Admission in College (Y) and an indirect effect mediated by the Department (M). This implies that gender might influence the choice of department, which in turn affects the likelihood of admission into college. The diagram suggests a potential for gender bias in admission processes, either directly or through departmental preferences.