## Diagram: Triangular Relationship Model
### Overview
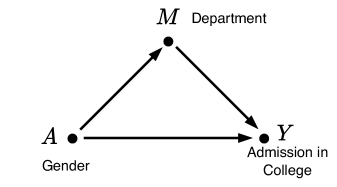
The image depicts a triangular diagram illustrating relationships between three variables: **Gender**, **Department**, and **Admission in College**. Arrows indicate directional influences between these nodes, forming a closed loop.
### Components/Axes
- **Nodes**:
- **A**: Labeled "Gender" (bottom-left vertex).
- **M**: Labeled "Department" (top vertex).
- **Y**: Labeled "Admission in College" (bottom-right vertex).
- **Arrows**:
- **A → M**: Gender influences Department.
- **M → Y**: Department influences Admission in College.
- **Y → A**: Admission in College influences Gender.
### Detailed Analysis
- **Textual Labels**:
- All nodes are explicitly labeled with their respective variables.
- Arrows are unidirectional, emphasizing causality or influence.
- **Structure**:
- The triangle is equilateral, with equal spacing between nodes.
- No numerical values, scales, or legends are present.
### Key Observations
- The diagram suggests a **cyclical relationship** where each variable mutually influences the others.
- No outliers or anomalies are depicted, as the model is purely structural.
### Interpretation
This diagram likely represents a **systemic model** where:
1. **Gender** (A) shapes choices or opportunities in **Department** (M).
2. **Department** (M) determines access to or success in **Admission in College** (Y).
3. **Admission in College** (Y) reinforces or challenges societal perceptions of **Gender** (A), creating feedback loops.
The absence of numerical data implies this is a conceptual framework, possibly used to analyze intersectional factors in educational equity or social dynamics. The cyclical nature highlights how systemic biases or structural barriers might perpetuate themselves across these variables.