## Bar Chart: Monthly Data Comparison (2022-2025)
### Overview
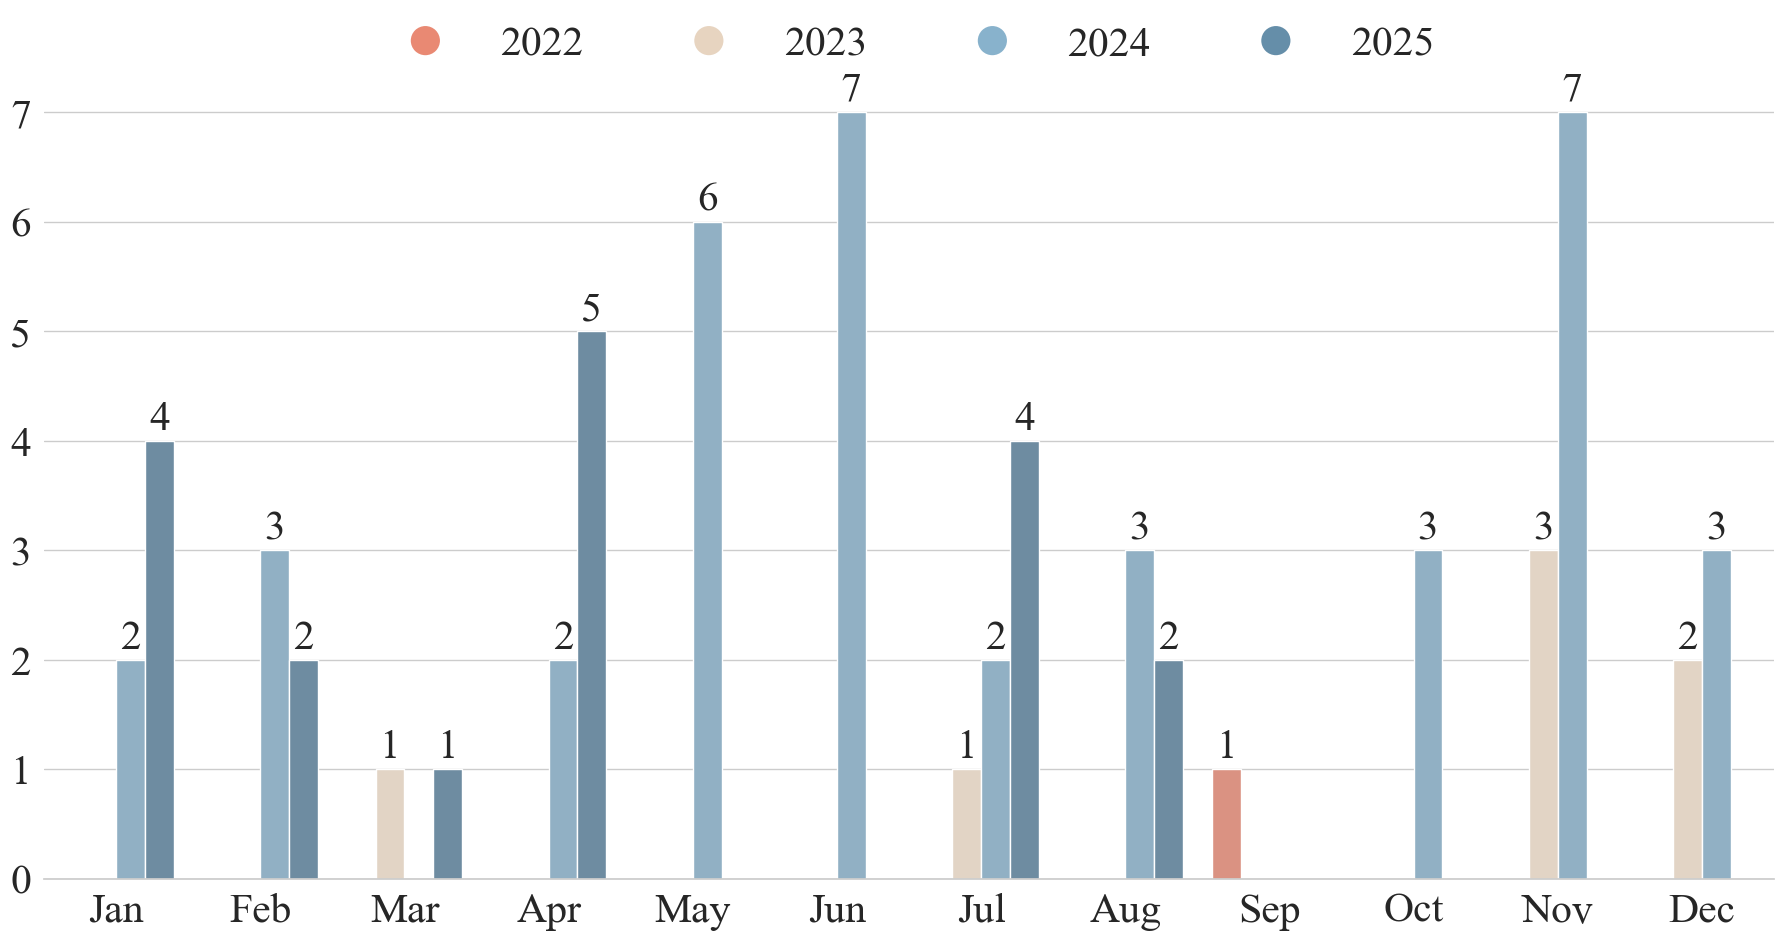
The image is a bar chart comparing monthly data across four years: 2022, 2023, 2024, and 2025. The x-axis represents the months of the year, and the y-axis represents a numerical value, ranging from 0 to 7. Each month has up to four bars representing the data for each year.
### Components/Axes
* **X-axis:** Months of the year (Jan, Feb, Mar, Apr, May, Jun, Jul, Aug, Sep, Oct, Nov, Dec)
* **Y-axis:** Numerical values ranging from 0 to 7, with gridlines at each integer value.
* **Legend:** Located at the top of the chart.
* Red: 2022
* Beige: 2023
* Light Blue: 2024
* Dark Blue: 2025
### Detailed Analysis
**2022 (Red)**
* Jan: 2
* Feb: 2
* Mar: 1
* Apr: 2
* May: No data
* Jun: No data
* Jul: 1
* Aug: 1
* Sep: 1
* Oct: No data
* Nov: No data
* Dec: 2
**Trend:** The 2022 data is only present for the first four months and then sparsely throughout the rest of the year. The values are generally low, with a peak of 2.
**2023 (Beige)**
* Jan: No data
* Feb: No data
* Mar: 1
* Apr: No data
* May: No data
* Jun: No data
* Jul: 1
* Aug: 2
* Sep: No data
* Oct: No data
* Nov: 3
* Dec: 2
**Trend:** The 2023 data is sparse, with values ranging from 1 to 3.
**2024 (Light Blue)**
* Jan: 2
* Feb: 2
* Mar: 1
* Apr: 2
* May: 6
* Jun: 7
* Jul: 2
* Aug: 2
* Sep: No data
* Oct: 3
* Nov: 3
* Dec: 2
**Trend:** The 2024 data shows a significant increase in May and June, reaching a peak of 7 in June.
**2025 (Dark Blue)**
* Jan: 4
* Feb: 3
* Mar: 1
* Apr: 5
* May: No data
* Jun: No data
* Jul: 4
* Aug: 3
* Sep: No data
* Oct: No data
* Nov: 7
* Dec: 3
**Trend:** The 2025 data starts high in January, fluctuates, and then peaks in November at 7.
### Key Observations
* 2024 and 2025 have more complete data sets compared to 2022 and 2023.
* June 2024 and November 2025 show the highest values (7).
* March consistently has low values across all years where data is available.
* September has no data for any year.
### Interpretation
The bar chart illustrates the monthly distribution of a certain metric across four years. The data suggests a potential seasonal trend, with peaks occurring in June (2024) and November (2025). The incomplete data for 2022 and 2023 makes it difficult to draw definitive conclusions about long-term trends. The significant increase in 2024 and 2025 could indicate a growth or change in the underlying process being measured. The lack of data in September is a notable anomaly that warrants further investigation.