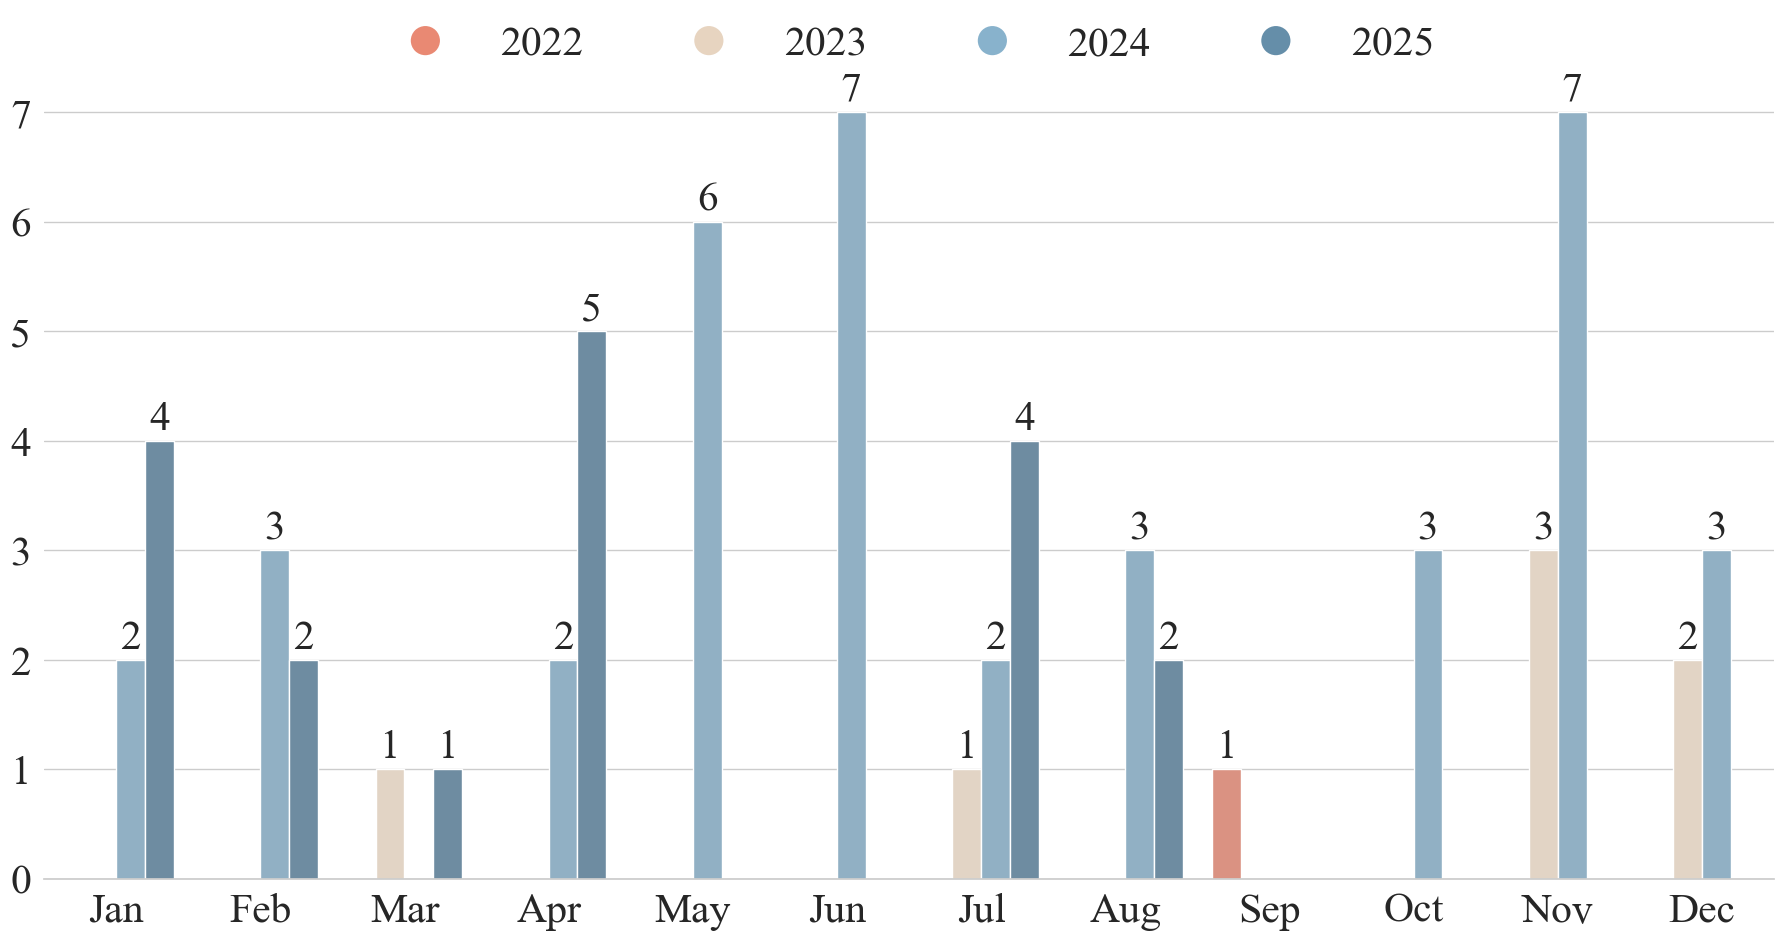
## Bar Chart: Monthly Counts by Year (2022-2025)
### Overview
This is a grouped bar chart displaying numerical counts for each month of the year, categorized by four distinct years: 2022, 2023, 2024, and 2025. The chart allows for comparison of monthly totals across these years.
### Components/Axes
* **X-Axis (Horizontal):** Represents the months of the year, labeled sequentially from "Jan" to "Dec".
* **Y-Axis (Vertical):** Represents a numerical count, with a linear scale from 0 to 7. Major gridlines are present at each integer value.
* **Legend:** Positioned at the top center of the chart. It defines the color coding for each year:
* **2022:** Red/Salmon color
* **2023:** Beige/Light Tan color
* **2024:** Light Blue color
* **2025:** Dark Blue/Grey-Blue color
* **Data Labels:** Each bar has a numerical label directly above it, indicating its exact value.
### Detailed Analysis
The following table reconstructs the data presented in the chart. A blank cell indicates no data bar is present for that year in the given month.
| Month | 2022 (Red) | 2023 (Beige) | 2024 (Light Blue) | 2025 (Dark Blue) |
| :--- | :---: | :---: | :---: | :---: |
| **Jan** | | | 2 | 4 |
| **Feb** | | | 3 | 2 |
| **Mar** | | 1 | | 1 |
| **Apr** | | | 2 | 5 |
| **May** | | | 6 | |
| **Jun** | | | 7 | |
| **Jul** | | 1 | 2 | 4 |
| **Aug** | | | 3 | 2 |
| **Sep** | 1 | | | |
| **Oct** | | | 3 | |
| **Nov** | | 3 | 7 | |
| **Dec** | | 2 | 3 | |
**Trend Verification by Series:**
* **2022 (Red):** A single data point appears in September with a value of 1. No trend can be established.
* **2023 (Beige):** Data is sporadic, appearing in Mar (1), Jul (1), Nov (3), and Dec (2). The trend is irregular with a peak in November.
* **2024 (Light Blue):** This series has the most complete data, present in every month except March. The trend shows a general increase from January (2) to a peak in June (7), a dip in July (2), a recovery in August (3), and another peak in November (7).
* **2025 (Dark Blue):** Data is present in Jan (4), Feb (2), Mar (1), Apr (5), Jul (4), and Aug (2). The trend is volatile, with a notable peak in April (5).
### Key Observations
1. **Dominance of 2024:** The year 2024 (light blue bars) has the highest overall counts and the most consistent monthly presence, achieving the chart's maximum value of 7 in both June and November.
2. **Sparse Early Data:** Data for 2022 and 2023 is very limited, suggesting the tracked metric may have begun in late 2022 or that counts were negligible prior to 2024.
3. **Monthly Peaks:** Significant peaks occur in June 2024 (7) and November 2024 (7). Another notable peak is in April 2025 (5).
4. **Low-Activity Months:** March shows the lowest combined activity, with only two bars each at value 1. September has only a single bar (2022, value 1).
### Interpretation
This chart likely tracks the frequency of a specific event, item, or metric on a monthly basis over a four-year period. The data suggests a significant ramp-up in activity starting in 2024, which becomes the dominant year for the measured quantity. The sporadic data for 2022 and 2023 could indicate the initial phase of a project, the rollout of a new service, or the beginning of data collection.
The bimodal peak in 2024 (June and November) might correspond to seasonal trends, project cycles, or specific campaigns. The volatility in the 2025 data, with a strong peak in April followed by a decline, could indicate a shift in patterns or the influence of external factors not visible in this chart alone. The absence of data for certain year-month combinations (e.g., no 2024 data in March) is a notable gap that would require contextual information to explain.