## Bar Chart: Monthly Data Trends (2022-2025)
### Overview
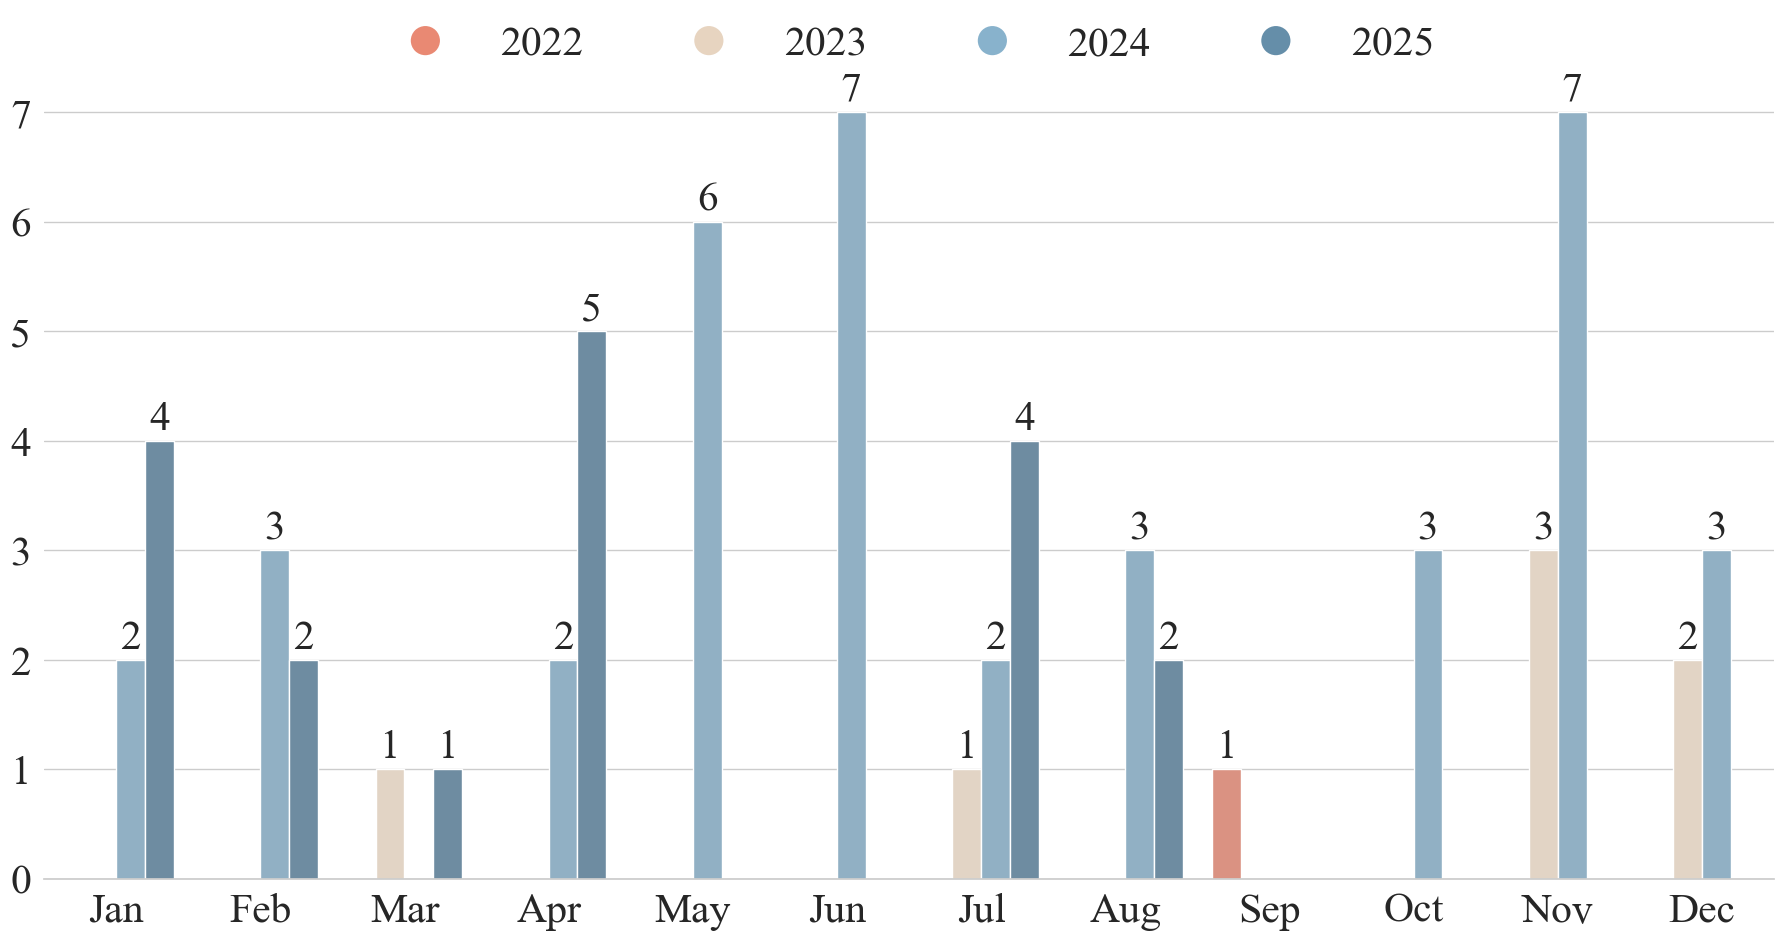
The chart displays monthly data trends across four years (2022–2025), with distinct color-coded bars for each year. The x-axis represents months (Jan–Dec), and the y-axis ranges from 0 to 7. Each month contains up to four bars (one per year), with some months showing only partial data (e.g., missing years). Dots represent single data points for specific years in certain months.
### Components/Axes
- **X-axis**: Months (Jan–Dec), labeled sequentially.
- **Y-axis**: Numerical values (0–7), with gridlines at integer intervals.
- **Legend**: Located at the top, associating colors with years:
- Red: 2022
- Beige: 2023
- Light Blue: 2024
- Dark Blue: 2025
- **Bars/Dots**: Vertical bars for most data points; dots for single-year entries in specific months.
### Detailed Analysis
#### Key Data Points by Month
- **Jan**:
- 2022: Red dot at 4
- 2023: Beige dot at 2
- 2024: Light blue bar at 2
- 2025: Dark blue bar at 4
- **Feb**:
- 2022: No data
- 2023: No data
- 2024: Light blue bar at 3
- 2025: Dark blue bar at 2
- **Mar**:
- 2022: No data
- 2023: Beige dot at 1
- 2024: No data
- 2025: Dark blue bar at 1
- **Apr**:
- 2022: No data
- 2023: No data
- 2024: Light blue bar at 2
- 2025: Dark blue bar at 5
- **May**:
- 2022: No data
- 2023: No data
- 2024: Light blue bar at 6
- 2025: No data
- **Jun**:
- 2022: No data
- 2023: No data
- 2024: Light blue bar at 7
- 2025: No data
- **Jul**:
- 2022: No data
- 2023: Beige dot at 1
- 2024: Light blue bar at 2
- 2025: Dark blue bar at 4
- **Aug**:
- 2022: No data
- 2023: No data
- 2024: Light blue bar at 3
- 2025: Dark blue bar at 2
- **Sep**:
- 2022: Red dot at 1
- 2023: No data
- 2024: No data
- 2025: No data
- **Oct**:
- 2022: No data
- 2023: No data
- 2024: Light blue bar at 3
- 2025: No data
- **Nov**:
- 2022: No data
- 2023: Beige bar at 3
- 2024: Light blue bar at 7
- 2025: Dark blue bar at 3
- **Dec**:
- 2022: No data
- 2023: Beige bar at 2
- 2024: Light blue bar at 3
- 2025: Dark blue bar at 3
### Key Observations
1. **Peaks**:
- 2024 reaches its highest value (7) in June and November.
- 2025 peaks at 5 in April and 7 in November.
2. **Lowest Values**:
- 2023 has minimal data (1 in March and July).
- 2022 has sparse data (1 in September).
3. **Trends**:
- 2024 shows a consistent upward trend until June, followed by a decline.
- 2025 exhibits volatility, with sharp increases (e.g., April to 5) and drops (e.g., July to 4).
- 2023 and 2022 have limited data points, suggesting incomplete records or lower activity.
### Interpretation
The chart highlights seasonal patterns, with 2024 and 2025 showing pronounced peaks in specific months (June and November). The absence of data for certain years in specific months (e.g., 2022 in March) may indicate missing records or negligible values. The 2025 data suggests cyclical fluctuations, while 2024’s steady rise and fall could reflect a predictable annual cycle. The 2023 data, though sparse, shows minimal activity in March and July, contrasting with 2024’s dominance in those months. The red dot in September 2022 (value 1) and beige dot in March 2023 (value 1) may represent outliers or unique events. Overall, the data implies that 2024 and 2025 are more active or significant than 2022 and 2023, with distinct monthly trends.