# Technical Document Extraction: Entity Frequency Distribution Analysis
## Chart Description
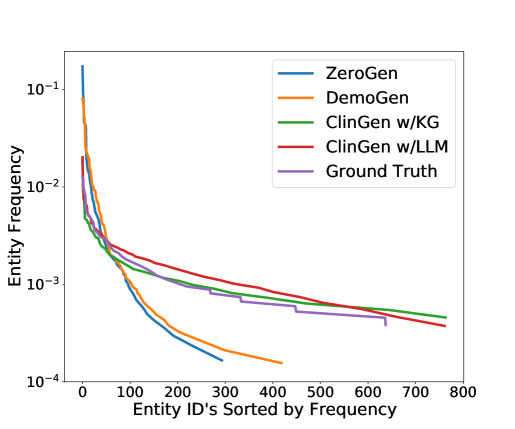
This line graph illustrates the distribution of entity frequencies across sorted entity IDs, comparing multiple generative models against ground truth data. The visualization uses a logarithmic scale on the y-axis to represent frequency magnitudes.
### Axis Labels and Markers
- **X-axis**: "Entity ID's Sorted by Frequency"
- Linear scale from 0 to 800 with increments of 100
- Represents entity identifiers ordered by descending frequency
- **Y-axis**: "Entity Frequency"
- Logarithmic scale from 10⁻⁴ to 10⁻¹
- Tick marks at 10⁻⁴, 10⁻³, 10⁻², and 10⁻¹
### Legend and Model Representation
| Color | Model/Reference | Line Characteristics |
|---------|--------------------------|-----------------------------------------------|
| Blue | ZeroGen | Steepest initial decline, terminates near ID 300 at ~10⁻³ frequency |
| Orange | DemoGen | Similar trajectory to ZeroGen, slightly less steep |
| Green | ClinGen w/KG | Smooth decline, closely follows Ground Truth |
| Red | ClinGen w/LLM | Gradual decline, overlaps with ClinGen w/KG at higher IDs |
| Purple | Ground Truth | Reference curve, smoothest distribution |
### Key Trends
1. **Frequency Distribution**:
- All models approximate the Ground Truth (purple), with ClinGen variants (green/red) showing the closest alignment.
- ZeroGen (blue) and DemoGen (orange) exhibit steeper declines, indicating fewer high-frequency entities compared to ClinGen approaches.
2. **Entity Rank vs. Frequency**:
- Top 100 entities (X-axis 0–100) show the highest frequency magnitudes (~10⁻¹ to 10⁻²).
- Frequency decays logarithmically across higher-ranked entities (X-axis >100).
3. **Model Performance**:
- ClinGen w/LLM (red) and ClinGen w/KG (green) maintain closer proximity to Ground Truth across all entity ranks.
- ZeroGen and DemoGen diverge significantly in the 0–300 ID range, suggesting limitations in capturing high-frequency entities.
### Technical Notes
- The logarithmic y-axis emphasizes differences in low-frequency entities.
- Entity IDs are sorted by descending frequency, making lower ID values correspond to more common entities.
- No overlapping lines occur beyond ID 300, where ZeroGen and DemoGen terminate.