## Scatter Plot: Computer Security Confidence vs. Target Length
### Overview
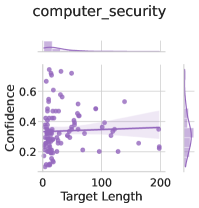
The image is a scatter plot titled "computer_security". It displays the relationship between "Target Length" on the x-axis and "Confidence" on the y-axis. The plot includes a regression line with a confidence interval. Histograms are displayed along the top and right edges, showing the distributions of Target Length and Confidence, respectively.
### Components/Axes
* **Title:** computer\_security
* **X-axis:** Target Length
* Scale: 0 to 200, with markers at 0, 100, and 200.
* **Y-axis:** Confidence
* Scale: 0 to 0.6, with markers at 0, 0.2, 0.4, and 0.6.
* **Data Points:** Purple scatter points representing individual data points.
* **Regression Line:** A purple line showing the linear regression fit to the data.
* **Confidence Interval:** A shaded purple region around the regression line, representing the confidence interval.
* **Histograms:**
* Top: Distribution of Target Length.
* Right: Distribution of Confidence.
### Detailed Analysis
* **Target Length:**
* The majority of data points are clustered between 0 and 50.
* The histogram shows a right-skewed distribution, indicating that most target lengths are small, with a few larger values.
* **Confidence:**
* Confidence values range from approximately 0.1 to 0.7.
* The histogram shows a distribution with a peak around 0.3-0.4.
* **Regression Line:**
* The regression line is nearly horizontal, indicating a weak or non-existent linear relationship between Target Length and Confidence.
* The confidence interval is relatively wide, suggesting high uncertainty in the regression estimate.
### Key Observations
* There is a high concentration of data points with low Target Length (0-50).
* The regression line suggests a very weak positive correlation between Target Length and Confidence.
* The wide confidence interval indicates that the relationship is not statistically significant.
### Interpretation
The scatter plot suggests that there is little to no linear relationship between "Target Length" and "Confidence" in the context of "computer_security". The clustering of data points at low target lengths indicates that most targets are relatively short. The wide confidence interval around the regression line suggests that any observed relationship is likely due to chance. The data implies that the length of the target is not a strong predictor of confidence, and other factors may be more important in determining confidence levels.