## Scatter Plot: computer_security
### Overview
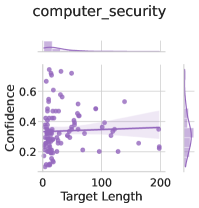
The image is a scatter plot titled "computer_security" with a main plot and two marginal distribution plots. The main plot shows the relationship between "Target Length" (x-axis) and "Confidence" (y-axis), while the top and right marginal plots display the distributions of these variables. The data points are purple, and a trend line with a shaded region is overlaid on the main plot.
### Components/Axes
- **Main Plot**:
- **X-axis (Target Length)**: Ranges from 0 to 200, labeled "Target Length".
- **Y-axis (Confidence)**: Ranges from 0 to 0.8, labeled "Confidence".
- **Data Points**: Purple dots scattered across the plot.
- **Trend Line**: A solid purple line with a shaded region (likely representing confidence intervals or uncertainty).
- **Marginal Plots**:
- **Top Plot**: Histogram of "Target Length" with a purple line indicating the distribution.
- **Right Plot**: Histogram of "Confidence" with a purple line indicating the distribution.
- **Legend**: No explicit legend is present in the image.
### Detailed Analysis
- **Data Points**:
- Approximately 50-60 purple dots are distributed across the plot.
- Most points cluster around the middle ranges of "Target Length" (50-150) and "Confidence" (0.3-0.6).
- A few outliers are visible at the extremes (e.g., low "Target Length" with high "Confidence" and vice versa).
- **Trend Line**:
- The trend line is nearly flat, suggesting minimal correlation between "Target Length" and "Confidence".
- The shaded region around the line is narrow, indicating low uncertainty in the trend estimation.
- **Marginal Distributions**:
- **Target Length**: The histogram peaks around 100-150, with a long tail toward higher values (up to 200).
- **Confidence**: The histogram peaks around 0.4-0.5, with a slight skew toward lower values (0.2-0.3).
### Key Observations
1. **Flat Trend Line**: The lack of a clear upward or downward slope suggests that "Confidence" does not significantly vary with "Target Length".
2. **Distribution Peaks**: Both variables show central tendencies, with most data points concentrated in mid-range values.
3. **Outliers**: A few data points deviate from the trend, but they are sparse and do not strongly influence the overall pattern.
### Interpretation
The data suggests that "Confidence" levels are relatively stable across different "Target Lengths", with a slight tendency to increase as "Target Length" grows. However, the flat trend line indicates that this relationship is weak or non-existent. The marginal distributions reveal that both variables have a central tendency, which might imply that the model or system being analyzed performs consistently for typical "Target Lengths". The shaded region around the trend line could represent uncertainty, but its narrowness suggests that the model's predictions are relatively reliable. The absence of a legend or explicit labels for the trend line leaves some ambiguity about its exact meaning (e.g., confidence interval, prediction interval). Overall, the plot highlights the need for further analysis to determine the causal or correlational relationship between the variables.