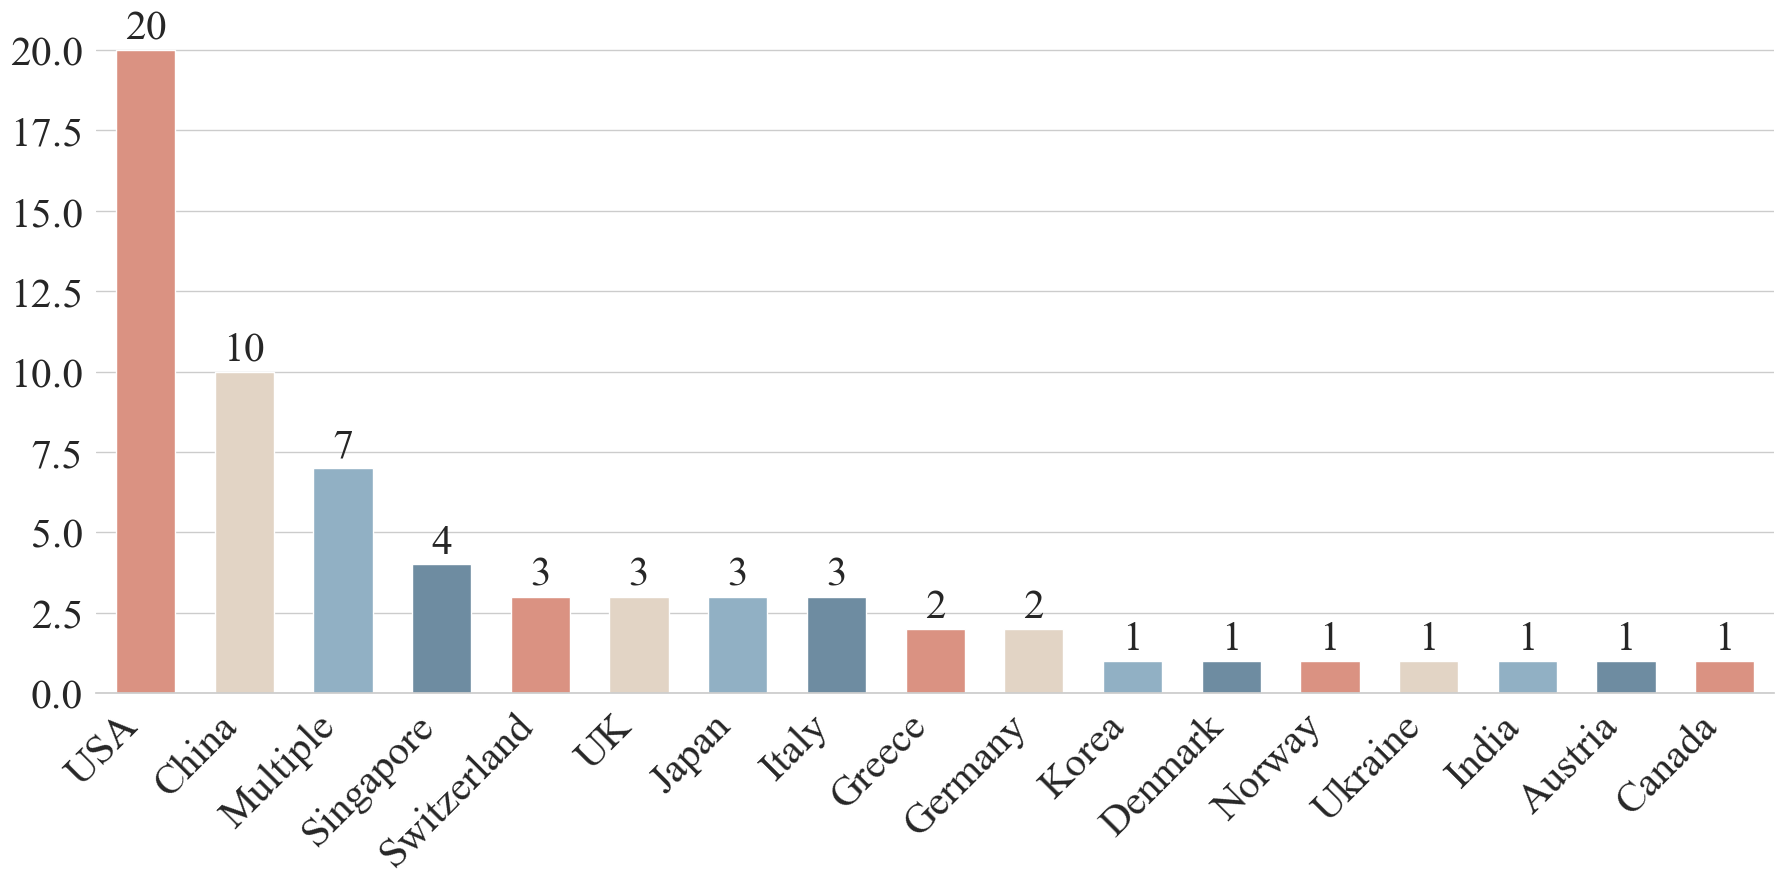
## Bar Chart: Distribution of [Unspecified Metric] by Country
### Overview
The chart displays a horizontal bar chart comparing a numerical metric across 18 countries. The x-axis lists countries, while the y-axis represents a numerical scale from 0 to 20. Each country is represented by a colored bar, with values explicitly labeled above the bars.
### Components/Axes
- **X-axis (Countries)**:
USA, China, Multiple, Singapore, Switzerland, UK, Japan, Italy, Greece, Germany, Korea, Denmark, Norway, Ukraine, India, Austria, Canada.
- **Y-axis (Numerical Scale)**:
Labeled from 0.0 to 20.0 in increments of 2.5.
- **Legend**:
No legend is present to explain the color coding of the bars.
### Detailed Analysis
- **USA**: Red bar, value **20.0** (highest).
- **China**: Beige bar, value **10.0** (second-highest).
- **Multiple**: Blue bar, value **7.0**.
- **Singapore**: Dark blue bar, value **4.0**.
- **Switzerland**: Red bar, value **3.0**.
- **UK**: Beige bar, value **3.0**.
- **Japan**: Blue bar, value **3.0**.
- **Italy**: Dark blue bar, value **3.0**.
- **Greece**: Red bar, value **2.0**.
- **Germany**: Beige bar, value **2.0**.
- **Korea**: Blue bar, value **1.0**.
- **Denmark**: Dark blue bar, value **1.0**.
- **Norway**: Red bar, value **1.0**.
- **Ukraine**: Beige bar, value **1.0**.
- **India**: Blue bar, value **1.0**.
- **Austria**: Dark blue bar, value **1.0**.
- **Canada**: Red bar, value **1.0**.
### Key Observations
1. **Dominance of USA and China**: The USA has the highest value (20.0), followed by China (10.0), which is half the USA’s value.
2. **Cluster of Lower Values**: Most countries (e.g., Singapore, Switzerland, UK, Japan, Italy) have values between 2.0 and 4.0.
3. **Tie for Lowest Values**: 10 countries (Korea, Denmark, Norway, Ukraine, India, Austria, Canada, and others) have values of **1.0**.
4. **Color Ambiguity**: Colors (red, beige, blue, dark blue) are used but lack a legend, making their significance unclear.
5. **"Multiple" Category**: The term "Multiple" is ambiguous and may refer to a group of countries or a data aggregation error.
### Interpretation
The chart highlights a stark disparity in the metric, with the USA and China dominating the distribution. The absence of a legend limits the ability to interpret the color coding, which could represent categories (e.g., regions, economic groups) or data types (e.g., population, GDP). The "Multiple" category introduces uncertainty, as its meaning is undefined. The clustering of low values among most countries suggests a possible focus on the top two nations, while the rest are marginalized. This could reflect geopolitical, economic, or technological dominance, but further context is needed to confirm the metric’s nature.