## Bar Chart: Distribution by Country
### Overview
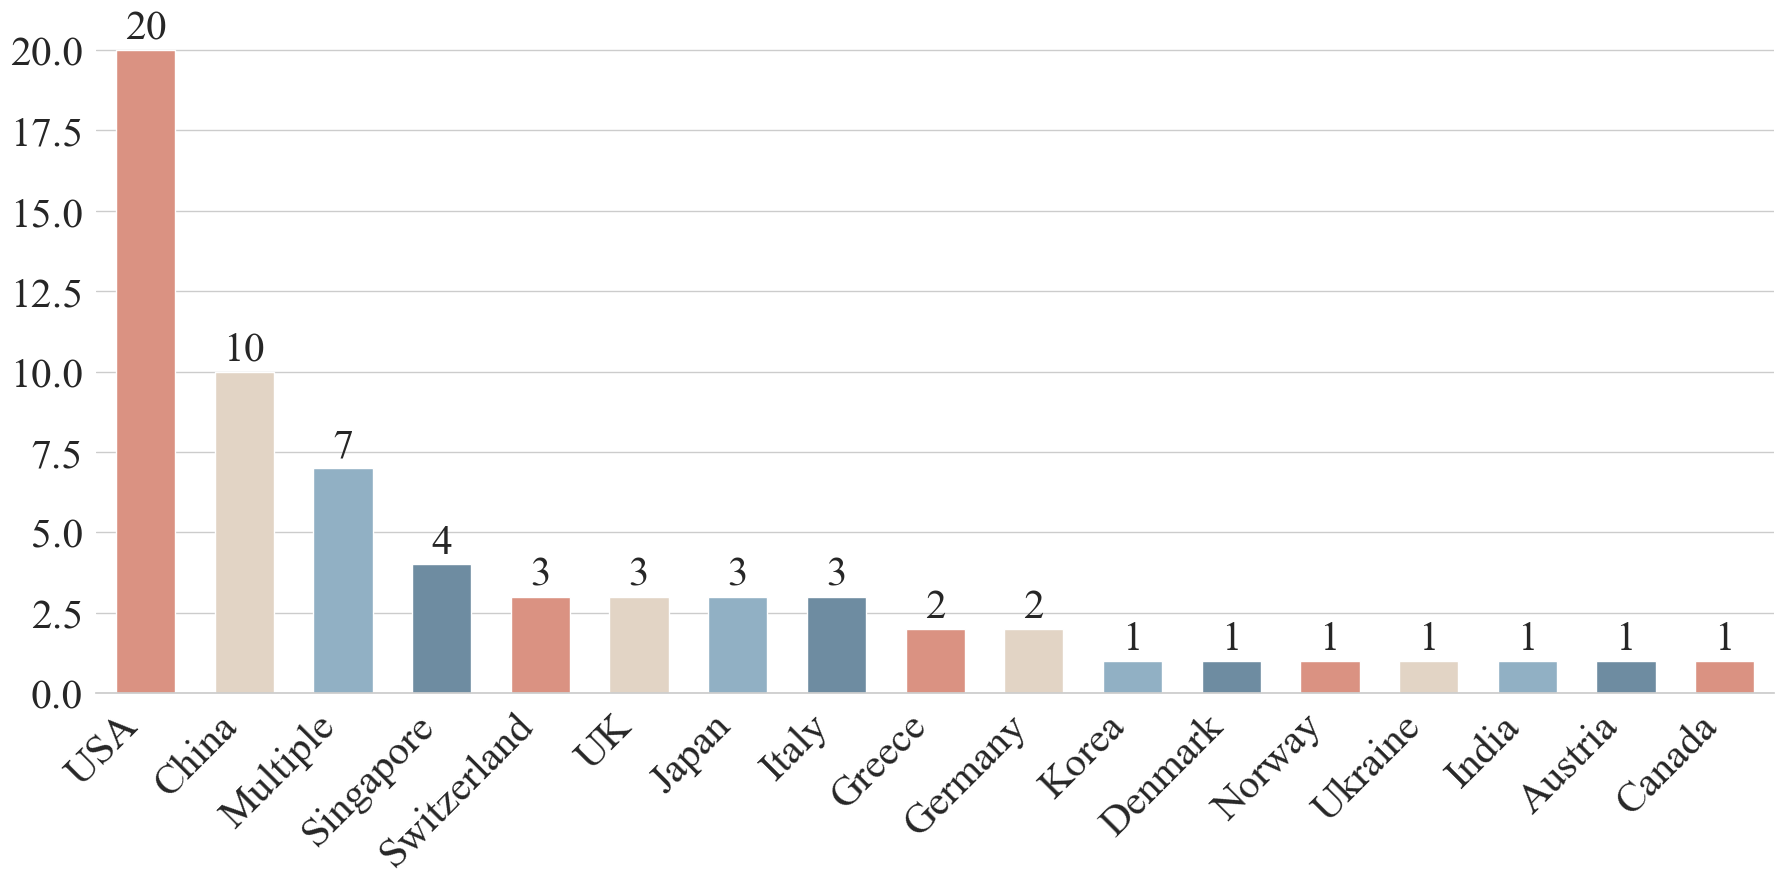
The image is a bar chart displaying the distribution of some unspecified quantity across different countries and a "Multiple" category. The y-axis represents a numerical value, and the x-axis represents the countries. The chart highlights the relative magnitudes of these values for each country.
### Components/Axes
* **Y-axis:** Numerical scale ranging from 0.0 to 20.0, with increments of 2.5.
* **X-axis:** Categorical axis representing countries and a "Multiple" category. The countries listed are: USA, China, Multiple, Singapore, Switzerland, UK, Japan, Italy, Greece, Germany, Korea, Denmark, Norway, Ukraine, India, Austria, Canada.
* **Bars:** Each bar represents a country or the "Multiple" category, with the height of the bar corresponding to the value on the y-axis.
* **Values:** Numerical values are displayed above each bar, indicating the exact height of the bar.
### Detailed Analysis
Here's a breakdown of the values for each category:
* **USA:** 20
* **China:** 10
* **Multiple:** 7
* **Singapore:** 4
* **Switzerland:** 3
* **UK:** 3
* **Japan:** 3
* **Italy:** 3
* **Greece:** 2
* **Germany:** 2
* **Korea:** 1
* **Denmark:** 1
* **Norway:** 1
* **Ukraine:** 1
* **India:** 1
* **Austria:** 1
* **Canada:** 1
### Key Observations
* The USA has the highest value, significantly greater than any other category.
* China has the second-highest value, half of that of the USA.
* The "Multiple" category has the third-highest value.
* Several countries (Switzerland, UK, Japan, Italy) share the same value of 3.
* Korea, Denmark, Norway, Ukraine, India, Austria, and Canada all have the same value of 1.
### Interpretation
The bar chart illustrates a distribution where the USA is a clear outlier with a significantly higher value compared to all other countries. China and the "Multiple" category also have relatively high values, while the remaining countries have considerably lower and more uniform values. The data suggests a strong concentration in the USA, followed by China, with a long tail of countries contributing smaller, similar amounts. The "Multiple" category suggests that a significant portion of the total value is attributable to instances involving multiple countries, rather than any single country besides the USA and China.