## Bar Charts: Throughput vs. Packet Delays
### Overview
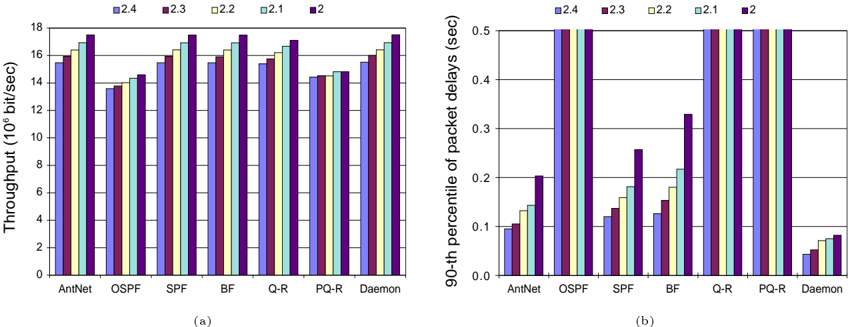
The image contains two bar charts comparing the throughput and packet delays of different network protocols (AntNet, OSPF, SPF, BF, Q-R, PQ-R, and Daemon) under varying conditions labeled as 2.4, 2.3, 2.2, 2.1, and 2. The first chart (a) displays throughput in 10^6 bits/sec, while the second chart (b) shows the 90th percentile of packet delays in seconds.
### Components/Axes
**Chart (a): Throughput**
* **Title:** Throughput (10^6 bit/sec)
* **X-axis:** Network Protocols (AntNet, OSPF, SPF, BF, Q-R, PQ-R, Daemon)
* **Y-axis:** Throughput (10^6 bit/sec), ranging from 0 to 18 with increments of 2.
* **Legend:** Located at the top of the chart.
* Blue: 2.4
* Purple: 2.3
* Yellow: 2.2
* Light Blue: 2.1
* Dark Purple: 2
**Chart (b): Packet Delays**
* **Title:** 90-th percentile of packet delays (sec)
* **X-axis:** Network Protocols (AntNet, OSPF, SPF, BF, Q-R, PQ-R, Daemon)
* **Y-axis:** 90-th percentile of packet delays (sec), ranging from 0.0 to 0.5 with increments of 0.1.
* **Legend:** Located at the top of the chart.
* Blue: 2.4
* Purple: 2.3
* Yellow: 2.2
* Light Blue: 2.1
* Dark Purple: 2
### Detailed Analysis
**Chart (a): Throughput**
* **AntNet:**
* 2.4 (Blue): ~16 x 10^6 bit/sec
* 2.3 (Purple): ~15 x 10^6 bit/sec
* 2.2 (Yellow): ~16 x 10^6 bit/sec
* 2.1 (Light Blue): ~17 x 10^6 bit/sec
* 2 (Dark Purple): ~16 x 10^6 bit/sec
* **OSPF:**
* 2.4 (Blue): ~13.5 x 10^6 bit/sec
* 2.3 (Purple): ~13.5 x 10^6 bit/sec
* 2.2 (Yellow): ~14 x 10^6 bit/sec
* 2.1 (Light Blue): ~14.5 x 10^6 bit/sec
* 2 (Dark Purple): ~14 x 10^6 bit/sec
* **SPF:**
* 2.4 (Blue): ~16 x 10^6 bit/sec
* 2.3 (Purple): ~16.5 x 10^6 bit/sec
* 2.2 (Yellow): ~17 x 10^6 bit/sec
* 2.1 (Light Blue): ~17 x 10^6 bit/sec
* 2 (Dark Purple): ~17.5 x 10^6 bit/sec
* **BF:**
* 2.4 (Blue): ~15.5 x 10^6 bit/sec
* 2.3 (Purple): ~16 x 10^6 bit/sec
* 2.2 (Yellow): ~16.5 x 10^6 bit/sec
* 2.1 (Light Blue): ~17 x 10^6 bit/sec
* 2 (Dark Purple): ~17.5 x 10^6 bit/sec
* **Q-R:**
* 2.4 (Blue): ~15.5 x 10^6 bit/sec
* 2.3 (Purple): ~16 x 10^6 bit/sec
* 2.2 (Yellow): ~16.5 x 10^6 bit/sec
* 2.1 (Light Blue): ~17 x 10^6 bit/sec
* 2 (Dark Purple): ~17 x 10^6 bit/sec
* **PQ-R:**
* 2.4 (Blue): ~14 x 10^6 bit/sec
* 2.3 (Purple): ~14.5 x 10^6 bit/sec
* 2.2 (Yellow): ~15 x 10^6 bit/sec
* 2.1 (Light Blue): ~15.5 x 10^6 bit/sec
* 2 (Dark Purple): ~15.5 x 10^6 bit/sec
* **Daemon:**
* 2.4 (Blue): ~17 x 10^6 bit/sec
* 2.3 (Purple): ~17.5 x 10^6 bit/sec
* 2.2 (Yellow): ~17.5 x 10^6 bit/sec
* 2.1 (Light Blue): ~17.5 x 10^6 bit/sec
* 2 (Dark Purple): ~17.5 x 10^6 bit/sec
**Chart (b): Packet Delays**
* **AntNet:**
* 2.4 (Blue): ~0.1 sec
* 2.3 (Purple): ~0.15 sec
* 2.2 (Yellow): ~0.17 sec
* 2.1 (Light Blue): ~0.2 sec
* 2 (Dark Purple): ~0.2 sec
* **OSPF:**
* 2.4 (Blue): ~0.5 sec
* 2.3 (Purple): ~0.5 sec
* 2.2 (Yellow): ~0.5 sec
* 2.1 (Light Blue): ~0.5 sec
* 2 (Dark Purple): ~0.5 sec
* **SPF:**
* 2.4 (Blue): ~0.14 sec
* 2.3 (Purple): ~0.16 sec
* 2.2 (Yellow): ~0.18 sec
* 2.1 (Light Blue): ~0.2 sec
* 2 (Dark Purple): ~0.26 sec
* **BF:**
* 2.4 (Blue): ~0.2 sec
* 2.3 (Purple): ~0.23 sec
* 2.2 (Yellow): ~0.25 sec
* 2.1 (Light Blue): ~0.27 sec
* 2 (Dark Purple): ~0.27 sec
* **Q-R:**
* 2.4 (Blue): ~0.5 sec
* 2.3 (Purple): ~0.5 sec
* 2.2 (Yellow): ~0.5 sec
* 2.1 (Light Blue): ~0.5 sec
* 2 (Dark Purple): ~0.5 sec
* **PQ-R:**
* 2.4 (Blue): ~0.5 sec
* 2.3 (Purple): ~0.5 sec
* 2.2 (Yellow): ~0.5 sec
* 2.1 (Light Blue): ~0.5 sec
* 2 (Dark Purple): ~0.5 sec
* **Daemon:**
* 2.4 (Blue): ~0.05 sec
* 2.3 (Purple): ~0.06 sec
* 2.2 (Yellow): ~0.07 sec
* 2.1 (Light Blue): ~0.075 sec
* 2 (Dark Purple): ~0.08 sec
### Key Observations
* **Throughput:** Daemon generally has the highest throughput across all conditions, while OSPF has the lowest.
* **Packet Delays:** Q-R and PQ-R consistently exhibit the highest packet delays, while Daemon has the lowest.
* **Trends:** For most protocols, throughput tends to increase slightly as the condition changes from 2.4 to 2. Packet delays generally increase as the condition changes from 2.4 to 2.
### Interpretation
The charts suggest a trade-off between throughput and packet delay among the different network protocols. Daemon, for instance, offers high throughput but at the cost of relatively low packet delays. Conversely, Q-R and PQ-R prioritize low packet delays but suffer from lower throughput. The conditions labeled 2.4, 2.3, 2.2, 2.1, and 2 likely represent different network configurations or environmental factors affecting performance. The data indicates that the choice of protocol should be tailored to the specific requirements of the network application, balancing the need for high throughput with the tolerance for packet delays.