\n
## Bar Charts: Throughput and 90th Percentile Packet Delays
### Overview
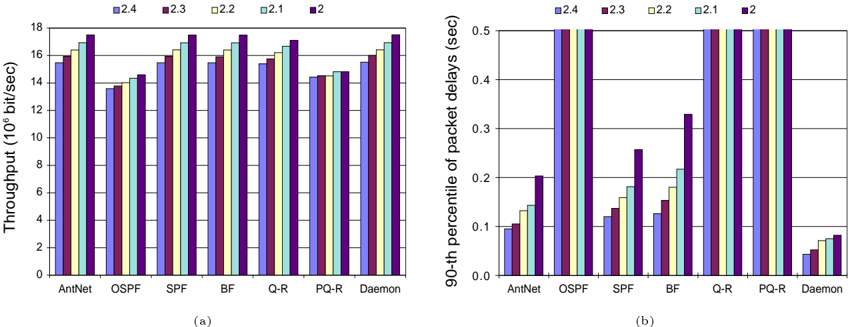
The image presents two bar charts side-by-side. Chart (a) displays throughput (in 10^6 bit/sec) for different network protocols (AntNet, OSPF, SPF, BF, Q-R, PQ-R, Daemon) under varying parameter settings (2.4, 2.3, 2.2, 2.1, 2). Chart (b) shows the 90th percentile of packet delays (in seconds) for the same protocols and parameter settings.
### Components/Axes
**Chart (a): Throughput**
* **X-axis:** Network Protocols - AntNet, OSPF, SPF, BF, Q-R, PQ-R, Daemon
* **Y-axis:** Throughput (10^6 bit/sec) - Scale ranges from 0 to 18, with increments of 2.
* **Legend:** Located at the top, indicating parameter settings: 2.4 (dark green), 2.3 (light green), 2.2 (pale green), 2.1 (lavender), 2 (purple).
**Chart (b): 90th Percentile Packet Delays**
* **X-axis:** Network Protocols - AntNet, OSPF, SPF, BF, Q-R, PQ-R, Daemon
* **Y-axis:** 90th percentile of packet delays (sec) - Scale ranges from 0 to 0.5, with increments of 0.1.
* **Legend:** Located at the top, identical to Chart (a): 2.4 (dark green), 2.3 (light green), 2.2 (pale green), 2.1 (lavender), 2 (purple).
### Detailed Analysis or Content Details
**Chart (a): Throughput**
* **AntNet:**
* 2.4: ~16.8 x 10^6 bit/sec
* 2.3: ~16.2 x 10^6 bit/sec
* 2.2: ~15.8 x 10^6 bit/sec
* 2.1: ~15.5 x 10^6 bit/sec
* 2: ~15.2 x 10^6 bit/sec
* **OSPF:**
* 2.4: ~14.5 x 10^6 bit/sec
* 2.3: ~13.8 x 10^6 bit/sec
* 2.2: ~13.2 x 10^6 bit/sec
* 2.1: ~12.8 x 10^6 bit/sec
* 2: ~12.5 x 10^6 bit/sec
* **SPF:**
* 2.4: ~16.5 x 10^6 bit/sec
* 2.3: ~15.8 x 10^6 bit/sec
* 2.2: ~15.2 x 10^6 bit/sec
* 2.1: ~14.8 x 10^6 bit/sec
* 2: ~14.5 x 10^6 bit/sec
* **BF:**
* 2.4: ~15.5 x 10^6 bit/sec
* 2.3: ~14.8 x 10^6 bit/sec
* 2.2: ~14.2 x 10^6 bit/sec
* 2.1: ~13.8 x 10^6 bit/sec
* 2: ~13.5 x 10^6 bit/sec
* **Q-R:**
* 2.4: ~15.2 x 10^6 bit/sec
* 2.3: ~14.5 x 10^6 bit/sec
* 2.2: ~13.9 x 10^6 bit/sec
* 2.1: ~13.5 x 10^6 bit/sec
* 2: ~13.2 x 10^6 bit/sec
* **PQ-R:**
* 2.4: ~15.0 x 10^6 bit/sec
* 2.3: ~14.3 x 10^6 bit/sec
* 2.2: ~13.7 x 10^6 bit/sec
* 2.1: ~13.3 x 10^6 bit/sec
* 2: ~13.0 x 10^6 bit/sec
* **Daemon:**
* 2.4: ~15.8 x 10^6 bit/sec
* 2.3: ~15.1 x 10^6 bit/sec
* 2.2: ~14.5 x 10^6 bit/sec
* 2.1: ~14.1 x 10^6 bit/sec
* 2: ~13.8 x 10^6 bit/sec
**Chart (b): 90th Percentile Packet Delays**
* **AntNet:**
* 2.4: ~0.08 sec
* 2.3: ~0.09 sec
* 2.2: ~0.10 sec
* 2.1: ~0.11 sec
* 2: ~0.12 sec
* **OSPF:**
* 2.4: ~0.06 sec
* 2.3: ~0.07 sec
* 2.2: ~0.08 sec
* 2.1: ~0.09 sec
* 2: ~0.10 sec
* **SPF:**
* 2.4: ~0.15 sec
* 2.3: ~0.14 sec
* 2.2: ~0.13 sec
* 2.1: ~0.12 sec
* 2: ~0.11 sec
* **BF:**
* 2.4: ~0.24 sec
* 2.3: ~0.23 sec
* 2.2: ~0.22 sec
* 2.1: ~0.21 sec
* 2: ~0.20 sec
* **Q-R:**
* 2.4: ~0.28 sec
* 2.3: ~0.27 sec
* 2.2: ~0.26 sec
* 2.1: ~0.25 sec
* 2: ~0.24 sec
* **PQ-R:**
* 2.4: ~0.27 sec
* 2.3: ~0.26 sec
* 2.2: ~0.25 sec
* 2.1: ~0.24 sec
* 2: ~0.23 sec
* **Daemon:**
* 2.4: ~0.04 sec
* 2.3: ~0.05 sec
* 2.2: ~0.06 sec
* 2.1: ~0.07 sec
* 2: ~0.08 sec
### Key Observations
* **Throughput:** Generally, throughput decreases as the parameter value decreases for all protocols. AntNet and SPF consistently exhibit the highest throughput.
* **Packet Delays:** Packet delays generally increase as the parameter value decreases. BF, Q-R, and PQ-R consistently exhibit the highest packet delays. Daemon has the lowest packet delays.
* **Trade-off:** There appears to be a trade-off between throughput and packet delays. Protocols with higher throughput (AntNet, SPF) tend to have lower packet delays, while those with lower throughput (BF, Q-R, PQ-R) have higher packet delays.
### Interpretation
The data suggests that the parameter setting significantly impacts both throughput and packet delays in these network protocols. Higher parameter values (2.4) generally lead to better throughput but potentially at the cost of increased packet delays in some protocols. Conversely, lower parameter values (2) result in lower throughput but can reduce packet delays.
The consistent performance of AntNet and SPF in terms of throughput, coupled with their relatively low packet delays, indicates they may be more efficient protocols for high-bandwidth applications. The higher delays observed in BF, Q-R, and PQ-R suggest they might be more suitable for applications where throughput is less critical than minimizing latency.
The observed trade-off highlights the importance of selecting a protocol and parameter setting that aligns with the specific requirements of the network application. The data provides valuable insights for network designers and administrators to optimize network performance based on application needs. The consistent trend across all protocols suggests a fundamental relationship between the parameter and performance metrics, warranting further investigation into the underlying mechanisms driving this behavior.