## Comparative Performance Analysis: Throughput and Packet Delay
### Overview
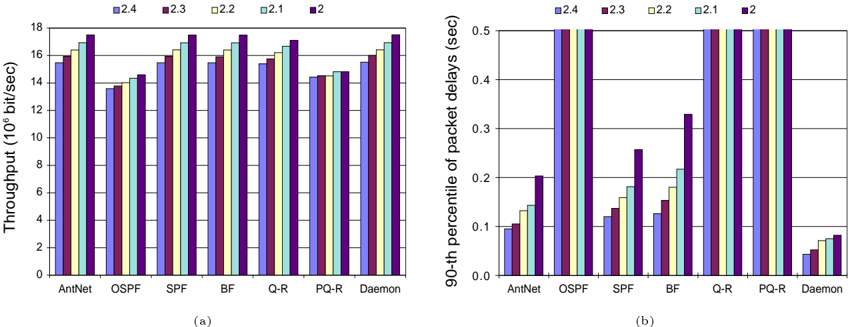
The image displays two side-by-side bar charts, labeled (a) and (b), comparing the performance of seven different network routing or management protocols across five software versions. The protocols are AntNet, OSPF, SPF, BF, Q-R, PQ-R, and Daemon. The software versions are 2.4, 2.3, 2.2, 2.1, and 2. Chart (a) measures throughput, while chart (b) measures the 90th percentile of packet delays.
### Components/Axes
**Common Elements:**
* **X-Axis (Both Charts):** Lists seven protocol categories: `AntNet`, `OSPF`, `SPF`, `BF`, `Q-R`, `PQ-R`, `Daemon`.
* **Legend (Top Center of Each Chart):** A horizontal legend identifies five data series by color and version number:
* Blue: `2.4`
* Maroon: `2.3`
* Yellow: `2.2`
* Light Cyan: `2.1`
* Dark Purple: `2`
**Chart (a) - Left:**
* **Title/Label:** `(a)` is centered below the chart.
* **Y-Axis Label:** `Throughput (10^6 bit/sec)`.
* **Y-Axis Scale:** Linear scale from 0 to 18, with major tick marks every 2 units.
**Chart (b) - Right:**
* **Title/Label:** `(b)` is centered below the chart.
* **Y-Axis Label:** `90-th percentile of packet delays (sec)`.
* **Y-Axis Scale:** Linear scale from 0.0 to 0.5, with major tick marks every 0.1 seconds.
### Detailed Analysis
#### Chart (a): Throughput (10^6 bit/sec)
**Trend Verification:** For most protocols, throughput generally increases from version 2.4 (blue) to version 2 (dark purple), with version 2 often being the highest. The exception is OSPF, where version 2.4 is the highest.
**Data Points (Approximate Values):**
* **AntNet:** Shows a steady increase. v2.4 ≈ 15.2, v2.3 ≈ 15.8, v2.2 ≈ 16.2, v2.1 ≈ 16.8, v2 ≈ 17.5.
* **OSPF:** Shows a decrease then increase. v2.4 ≈ 13.8, v2.3 ≈ 13.5, v2.2 ≈ 14.0, v2.1 ≈ 14.2, v2 ≈ 14.5.
* **SPF:** Shows a steady increase. v2.4 ≈ 15.5, v2.3 ≈ 16.0, v2.2 ≈ 16.5, v2.1 ≈ 17.0, v2 ≈ 17.5.
* **BF:** Shows a steady increase. v2.4 ≈ 15.5, v2.3 ≈ 16.0, v2.2 ≈ 16.5, v2.1 ≈ 17.0, v2 ≈ 17.5.
* **Q-R:** Shows a steady increase. v2.4 ≈ 15.2, v2.3 ≈ 15.8, v2.2 ≈ 16.2, v2.1 ≈ 16.8, v2 ≈ 17.2.
* **PQ-R:** Shows a steady increase. v2.4 ≈ 14.2, v2.3 ≈ 14.5, v2.2 ≈ 14.8, v2.1 ≈ 15.0, v2 ≈ 15.2.
* **Daemon:** Shows a steady increase. v2.4 ≈ 15.5, v2.3 ≈ 16.0, v2.2 ≈ 16.5, v2.1 ≈ 17.0, v2 ≈ 17.5.
#### Chart (b): 90th Percentile of Packet Delays (sec)
**Trend Verification:** Delay trends are more varied. Some protocols (OSPF, Q-R) show very high delays (capped at 0.5 sec) for multiple versions. Others (AntNet, Daemon) show consistently low delays with a slight increasing trend. SPF and BF show a clear increasing trend in delay across versions.
**Data Points (Approximate Values):**
* **AntNet:** Low and slightly increasing. v2.4 ≈ 0.10, v2.3 ≈ 0.12, v2.2 ≈ 0.14, v2.1 ≈ 0.15, v2 ≈ 0.20.
* **OSPF:** Very high, at or near the 0.5 sec cap for all versions except v2.3 (≈0.5) and v2 (≈0.5). v2.4, v2.2, v2.1 appear to be exactly at 0.5.
* **SPF:** Clear increasing trend. v2.4 ≈ 0.11, v2.3 ≈ 0.14, v2.2 ≈ 0.16, v2.1 ≈ 0.18, v2 ≈ 0.26.
* **BF:** Clear increasing trend. v2.4 ≈ 0.13, v2.3 ≈ 0.15, v2.2 ≈ 0.18, v2.1 ≈ 0.20, v2 ≈ 0.33.
* **Q-R:** Very high, at or near the 0.5 sec cap for all versions. v2.4, v2.3, v2.2, v2.1 appear to be exactly at 0.5. v2 is slightly lower, ≈0.5.
* **PQ-R:** Very high, at or near the 0.5 sec cap for all versions. All five bars appear to be exactly at 0.5.
* **Daemon:** Lowest overall, slightly increasing. v2.4 ≈ 0.04, v2.3 ≈ 0.05, v2.2 ≈ 0.06, v2.1 ≈ 0.07, v2 ≈ 0.08.
### Key Observations
1. **Throughput vs. Delay Trade-off:** Protocols with the highest throughput (e.g., SPF, BF, Daemon in later versions) do not necessarily have the lowest packet delay. Daemon achieves both high throughput and the lowest delay.
2. **Performance Extremes:**
* **Best Overall:** `Daemon` shows excellent performance: high, improving throughput and the lowest, most stable packet delays.
* **Worst for Delay:** `OSPF`, `Q-R`, and `PQ-R` exhibit severe packet delay issues, with their 90th percentile often hitting the 0.5-second cap, which could indicate congestion or poor queue management.
3. **Version Impact:** For throughput, newer versions (2, 2.1) generally perform better. For delay, the impact is protocol-specific; newer versions sometimes increase delay (SPF, BF, AntNet) while for others (OSPF, Q-R) the delay is consistently poor.
4. **Anomaly:** `OSPF`'s throughput is an outlier in trend, being highest in the oldest version (2.4) and lower in subsequent versions before recovering slightly.
### Interpretation
This data suggests a comparative study of routing protocol implementations across software releases. The key takeaway is that **protocol choice has a more significant impact on performance than incremental version updates.**
* **Daemon** appears to be the most robust and efficient protocol in this test, scaling well in throughput while maintaining minimal latency.
* The high, capped delays for **OSPF, Q-R, and PQ-R** are a major red flag. In a real network, a 90th percentile delay of 0.5 seconds would severely impact real-time applications like VoIP or video streaming. This could be due to algorithmic complexity, inefficient packet processing, or poor handling of network load in these specific implementations.
* The general trend of increasing delay for **SPF and BF** as throughput increases suggests these protocols may be pushing the system closer to its saturation point, where queuing delays become significant.
* The charts effectively highlight that optimizing for a single metric (like throughput) is insufficient. A holistic view, including latency metrics like the 90th percentile delay, is crucial for selecting a protocol suitable for performance-sensitive applications. The `Daemon` protocol demonstrates that high throughput and low latency can be achieved simultaneously.