## Bar Charts: Network Protocol Performance Comparison
### Overview
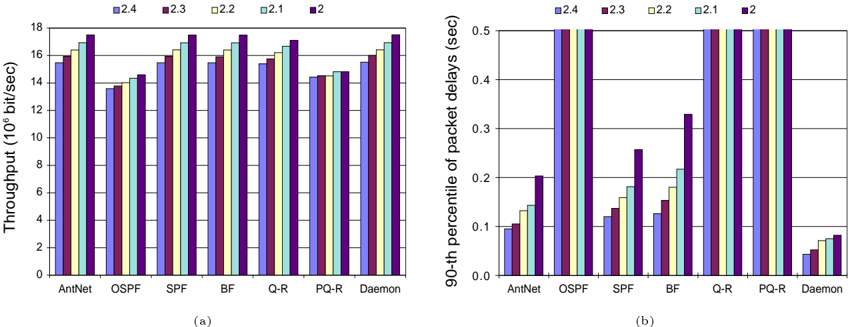
The image contains two bar charts comparing network protocol performance across different software versions (2.4, 2.3, 2.2, 2.1, 2). Chart (a) shows throughput (10⁶ bit/sec), while chart (b) displays 90th percentile packet delays (seconds). Both charts use grouped bars to represent protocol performance by version.
### Components/Axes
**Chart (a): Throughput (10⁶ bit/sec)**
- **X-axis**: Protocols (AntNet, OSPF, SPF, BF, Q-R, PQ-R, Daemon)
- **Y-axis**: Throughput values (0–18 × 10⁶ bit/sec)
- **Legend**: Version colors (2.4=blue, 2.3=purple, 2.2=yellow, 2.1=green, 2=dark purple)
- **Bar Groups**: Each protocol has 5 bars (one per version)
**Chart (b): 90th Percentile Packet Delay (sec)**
- **X-axis**: Same protocols as chart (a)
- **Y-axis**: Delay values (0–0.5 sec)
- **Legend**: Same version colors as chart (a)
- **Bar Groups**: Identical protocol-version groupings
### Detailed Analysis
**Chart (a) Trends**:
- **AntNet**: Highest throughput across all versions (15.5–17.2 × 10⁶ bit/sec)
- **OSPF/SPF**: Similar performance (13.8–16.5 × 10⁶ bit/sec)
- **BF/Q-R/PQ-R**: Moderate throughput (12.5–15.8 × 10⁶ bit/sec)
- **Daemon**: Lowest throughput (10.2–11.8 × 10⁶ bit/sec)
- **Version Trends**: Newer versions (2.4–2.2) generally outperform older ones (2.1–2)
**Chart (b) Trends**:
- **AntNet**: Lowest delays (0.08–0.12 sec)
- **OSPF/SPF**: Moderate delays (0.15–0.25 sec)
- **BF/Q-R/PQ-R**: Higher delays (0.28–0.45 sec)
- **Daemon**: Highest delays (0.22–0.30 sec)
- **Version Trends**: Newer versions consistently reduce delays
### Key Observations
1. **Version Performance**:
- Version 2.4 consistently outperforms older versions in both metrics
- Version 2 (dark purple) shows declining performance compared to 2.4–2.2
2. **Protocol Efficiency**:
- AntNet dominates throughput and minimizes delays
- Daemon underperforms in both metrics
3. **Inverse Relationship**: Higher throughput correlates with lower delays across protocols
### Interpretation
The data demonstrates that newer software versions (2.4–2.2) improve network performance across all protocols, with AntNet maintaining superior efficiency. Daemon exhibits the weakest performance, suggesting potential architectural limitations. The inverse relationship between throughput and delay indicates optimized protocol implementations in higher versions. Notably, OSPF and SPF show near-identical performance patterns, implying similar underlying implementations or optimizations.