## Heatmap: SnapKV Performance by Context Length
### Overview
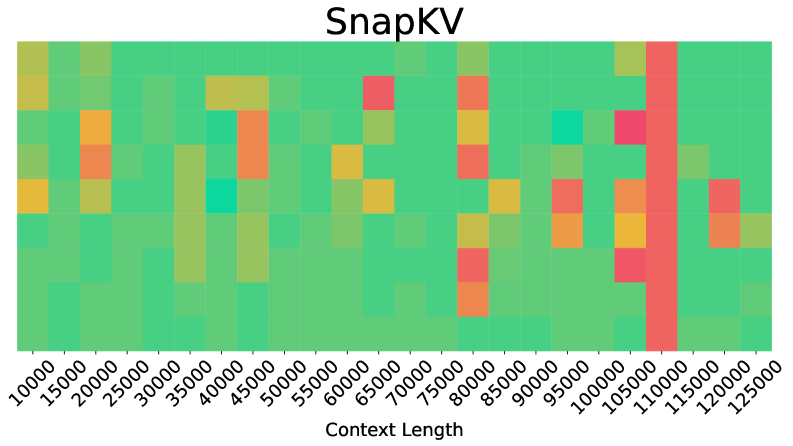
The image displays a heatmap titled "SnapKV" visualizing performance metrics across varying context lengths. The chart uses a color gradient (green to red) to represent values, with context length on the x-axis and an unlabeled y-axis. Key trends include clustered high-value (red) regions and sparse low-value (green) areas.
### Components/Axes
- **X-axis (Context Length)**: Labeled "Context Length" with discrete markers at 10k, 15k, 20k, ..., 125k (increments of 5k).
- **Y-axis**: No explicit label visible; likely represents a performance metric (e.g., latency, throughput) based on context.
- **Legend**: Located on the right, mapping colors to value ranges:
- Green: Low values
- Yellow: Medium values
- Orange: High values
- Red: Very high values
### Detailed Analysis
- **Color Distribution**:
- **Green (Low)**: Dominates lower context lengths (10k–40k) and scattered regions at higher lengths (e.g., 120k).
- **Yellow (Medium)**: Concentrated around 40k–80k context lengths.
- **Orange (High)**: Clustered at 80k–100k, with vertical red bars at 100k and 110k.
- **Red (Very High)**: Dominates 100k–110k, with a prominent vertical red bar at 110k.
- **Notable Patterns**:
- A vertical red "spike" at 110k context length spans the entire y-axis range.
- Red/orange regions are sparse below 80k and above 120k.
- Green/yellow regions are more evenly distributed outside 80k–110k.
### Key Observations
1. **High-Value Cluster**: The 100k–110k context length range exhibits the highest values (red), suggesting a critical threshold or anomaly.
2. **Performance Degradation**: Values increase sharply at 100k, peaking at 110k, then drop to green/yellow at 120k+.
3. **Missing Y-Axis Label**: The unlabeled y-axis prevents precise interpretation of the metric (e.g., latency vs. throughput).
### Interpretation
The heatmap suggests that **SnapKV performance degrades significantly at context lengths near 100k–110k**, with a pronounced spike at 110k. This could indicate:
- **Resource Saturation**: High context lengths may exhaust memory or processing capacity.
- **Algorithmic Inefficiency**: A specific configuration or bug causing bottlenecks at 110k.
- **Threshold Effect**: A design limitation where performance collapses beyond 100k context.
The absence of a y-axis label limits quantitative analysis, but the red/orange dominance at 100k–110k implies a critical failure point. Further investigation into the y-axis metric (e.g., latency spikes) is needed to confirm causality.