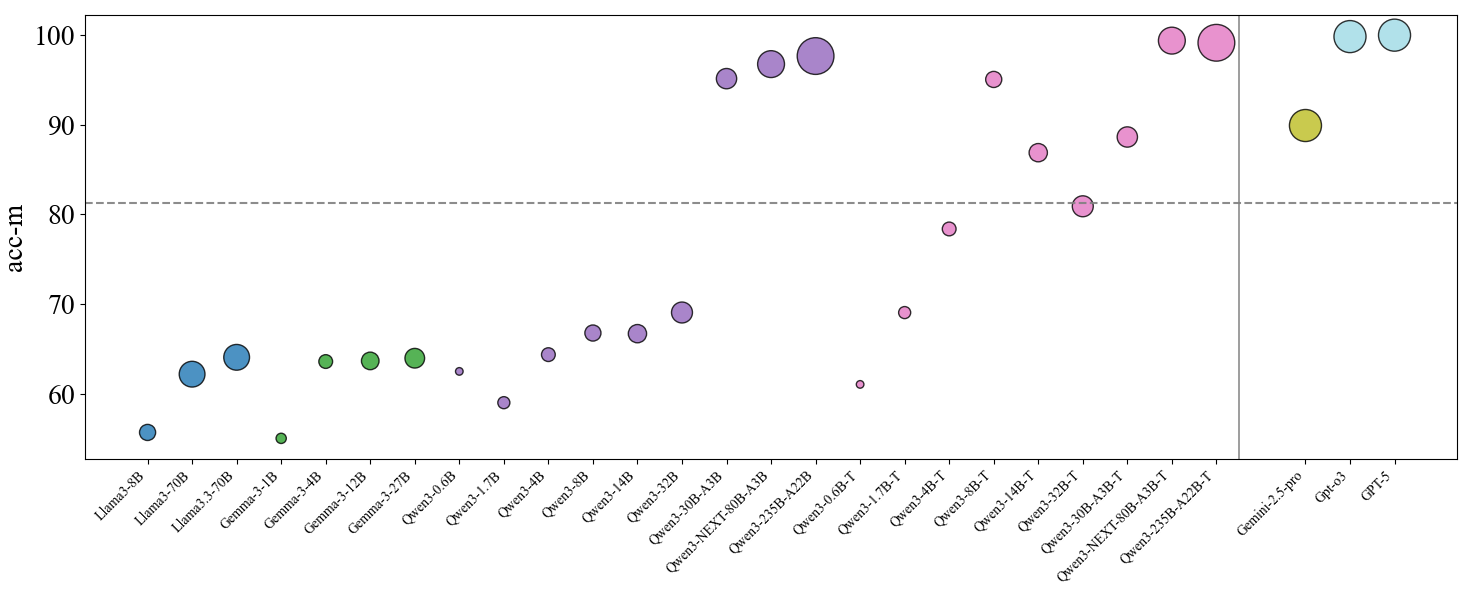
## Scatter Plot: Model Accuracy Comparison
### Overview
The image is a scatter plot comparing the accuracy (acc-m) of various AI language models. The x-axis lists model names (e.g., Llama3-8B, GPT-5), while the y-axis represents accuracy in milli-units (50–100). A dashed horizontal line at 80 marks a performance threshold. Data points are color-coded by model family, with sizes varying (though size encoding is not explicitly labeled).
### Components/Axes
- **X-axis**: Model names (e.g., Llama3-8B, Llama3-70B, Gemini-2.5-pro, GPT-5). Labels are spaced unevenly, with larger models (e.g., GPT-5) positioned far right.
- **Y-axis**: Accuracy (acc-m), ranging from 50 to 100. A dashed line at 80 is labeled as a benchmark.
- **Legend**: Located on the far right, associating colors with model families:
- Blue: Llama3
- Green: Gemma3
- Purple: Qwen3
- Pink: Qwen3-NEXT
- Yellow: Gemini
- Light Blue: GPT
### Detailed Analysis
- **Llama3 Models**:
- Llama3-8B (blue, ~55 acc-m)
- Llama3-70B (blue, ~63 acc-m)
- Llama3-3-1B (blue, ~55 acc-m)
- Llama3-3-12B (blue, ~64 acc-m)
- Llama3-3-27B (blue, ~65 acc-m)
- **Gemma3 Models**:
- Gemma3-3-4B (green, ~64 acc-m)
- Gemma3-3-12B (green, ~64 acc-m)
- Gemma3-3-27B (green, ~65 acc-m)
- **Qwen3 Models**:
- Qwen3-3-0.6B (purple, ~62 acc-m)
- Qwen3-3-1.7B (purple, ~59 acc-m)
- Qwen3-3-4B (purple, ~65 acc-m)
- Qwen3-3-8B (purple, ~67 acc-m)
- Qwen3-3-14B (purple, ~67 acc-m)
- Qwen3-3-30B-A3B (purple, ~69 acc-m)
- Qwen3-3-30B-A3B (purple, ~95 acc-m)
- Qwen3-3-30B-A3B (purple, ~97 acc-m)
- Qwen3-3-30B-A3B (purple, ~98 acc-m)
- **Qwen3-NEXT Models**:
- Qwen3-3-0.6B-T (pink, ~61 acc-m)
- Qwen3-3-1.7B-T (pink, ~79 acc-m)
- Qwen3-3-4B-T (pink, ~79 acc-m)
- Qwen3-3-8B-T (pink, ~88 acc-m)
- Qwen3-3-14B-T (pink, ~87 acc-m)
- Qwen3-3-30B-A3B-T (pink, ~98 acc-m)
- Qwen3-3-30B-A3B-T (pink, ~100 acc-m)
- **Gemini Models**:
- Gemini-2.5-pro (yellow, ~90 acc-m)
- **GPT Models**:
- GPT-3 (light blue, ~100 acc-m)
- GPT-4 (light blue, ~100 acc-m)
- GPT-5 (light blue, ~100 acc-m)
### Key Observations
1. **Model Size vs. Accuracy**: Larger models (e.g., Llama3-70B, GPT-5) generally achieve higher accuracy, with GPT-5 and Qwen3-NEXT-A3B-T reaching 100 acc-m.
2. **Threshold Performance**: Only models in the Qwen3-NEXT, Gemini, and GPT families exceed the 80 acc-m benchmark. Qwen3-NEXT-A3B-T and GPT-5 are the highest performers.
3. **Outliers**:
- Qwen3-3-0.6B (purple, ~62 acc-m) underperforms relative to its size.
- Gemini-2.5-pro (yellow, ~90 acc-m) lags behind GPT-5 despite similar size.
### Interpretation
The plot demonstrates a clear trend where larger models (e.g., GPT-5, Qwen3-NEXT-A3B-T) achieve near-perfect accuracy (100 acc-m), while smaller models (e.g., Llama3-8B, Qwen3-3-0.6B) struggle to reach the 80 acc-m threshold. The dashed line at 80 serves as a critical benchmark, separating mid-tier performers (e.g., Qwen3-3-8B-T at 88 acc-m) from top-tier models. Notably, GPT-5 and Qwen3-NEXT-A3B-T dominate the upper-right quadrant, suggesting architectural or training advantages. The absence of size encoding in the legend leaves uncertainty about whether point size correlates with model parameters or another metric. This visualization underscores the importance of model scale and optimization in achieving high accuracy.