## Bubble Chart: Model Accuracy Comparison
### Overview
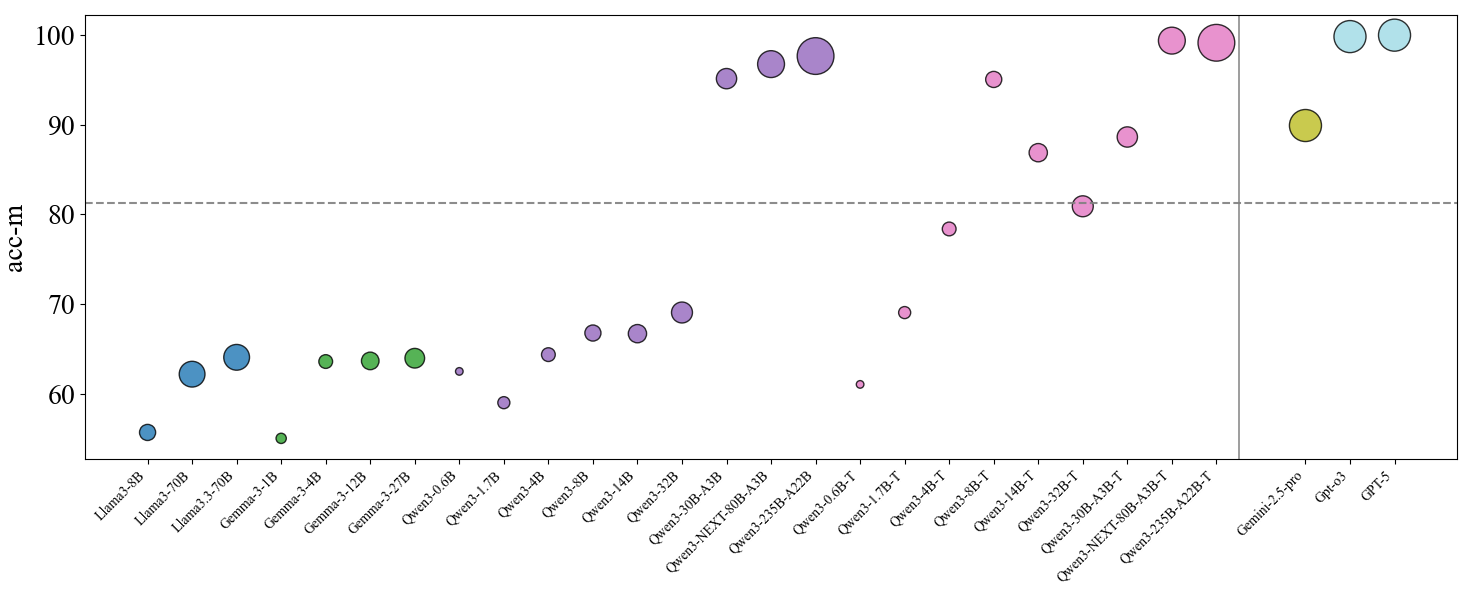
The image is a bubble chart comparing the accuracy (acc-m) of various language models. The x-axis lists the names of the models, and the y-axis represents the accuracy score. The size of each bubble corresponds to an unspecified metric, likely related to model size or another performance indicator. A horizontal dashed line is present at acc-m = 81, and a vertical line separates the Qwen models from the Gemini and GPT models.
### Components/Axes
* **X-axis:** Model Names (Llama3-8B, Llama3-70B, Llama3.3-70B, Gemma-3-1B, Gemma-3-4B, Gemma-3-12B, Gemma-3-27B, Qwen3-0.6B, Qwen3-1.7B, Qwen3-4B, Qwen3-8B, Qwen3-14B, Qwen3-32B, Qwen3-30B-A3B, Qwen3-NEXT-80B-A3B, Qwen3-235B-A22B, Qwen3-0.6B-T, Qwen3-1.7B-T, Qwen3-4B-T, Qwen3-8B-T, Qwen3-14B-T, Qwen3-32B-T, Qwen3-30B-A3B-T, Qwen3-NEXT-80B-A3B-T, Qwen3-235B-A22B-T, Gemini-2.5-pro, Gpt-o3, GPT-5)
* **Y-axis:** Accuracy (acc-m) ranging from 60 to 100, with tick marks at intervals of 10.
* **Bubbles:** Represent individual models, with their size varying.
* **Horizontal Dashed Line:** Located at acc-m = 81.
* **Vertical Solid Line:** Separates the Qwen models from the Gemini and GPT models.
### Detailed Analysis
The models are grouped into families: Llama3, Gemma, Qwen3, Gemini, and GPT.
* **Llama3 Models:**
* Llama3-8B: acc-m ≈ 56
* Llama3-70B: acc-m ≈ 62
* Llama3.3-70B: acc-m ≈ 64
* Trend: Accuracy increases with model size.
* **Gemma Models:**
* Gemma-3-1B: acc-m ≈ 54
* Gemma-3-4B: acc-m ≈ 63
* Gemma-3-12B: acc-m ≈ 63
* Gemma-3-27B: acc-m ≈ 64
* Trend: Relatively stable accuracy across different sizes.
* **Qwen3 Models (Base):**
* Qwen3-0.6B: acc-m ≈ 63
* Qwen3-1.7B: acc-m ≈ 62
* Qwen3-4B: acc-m ≈ 66
* Qwen3-8B: acc-m ≈ 67
* Qwen3-14B: acc-m ≈ 67
* Qwen3-32B: acc-m ≈ 69
* Qwen3-30B-A3B: acc-m ≈ 94
* Qwen3-NEXT-80B-A3B: acc-m ≈ 97
* Qwen3-235B-A22B: acc-m ≈ 99
* Trend: Accuracy generally increases with model size, with a significant jump for the larger models (30B and above).
* **Qwen3 Models (Tuned):**
* Qwen3-0.6B-T: acc-m ≈ 61
* Qwen3-1.7B-T: acc-m ≈ 78
* Qwen3-4B-T: acc-m ≈ 87
* Qwen3-8B-T: acc-m ≈ 81
* Qwen3-14B-T: acc-m ≈ 81
* Qwen3-32B-T: acc-m ≈ 87
* Qwen3-30B-A3B-T: acc-m ≈ 81
* Qwen3-NEXT-80B-A3B-T: acc-m ≈ 81
* Qwen3-235B-A22B-T: acc-m ≈ 81
* Trend: Accuracy varies, with some models showing improvement over their base counterparts.
* **Gemini and GPT Models:**
* Gemini-2.5-pro: acc-m ≈ 90
* Gpt-o3: acc-m ≈ 100
* GPT-5: acc-m ≈ 100
* Trend: High accuracy for these models.
### Key Observations
* The size of the bubbles varies significantly, suggesting a correlation with another metric besides accuracy.
* The horizontal line at acc-m = 81 serves as a visual benchmark.
* The Qwen3 models show a wide range of performance, with the larger models achieving high accuracy.
* The Gemini and GPT models demonstrate the highest accuracy scores.
### Interpretation
The bubble chart provides a comparative overview of the accuracy of different language models. The varying bubble sizes likely represent model complexity, training data size, or another relevant factor. The trend suggests that larger models generally achieve higher accuracy, although there are exceptions. The Qwen3 models show a significant jump in performance with increased size, indicating the potential benefits of scaling up model parameters. The Gemini and GPT models outperform the other models in terms of accuracy, suggesting they have more advanced architectures or training methodologies. The horizontal line at acc-m = 81 highlights models that achieve a certain level of performance.