## Performance vs. Token Length Charts
### Overview
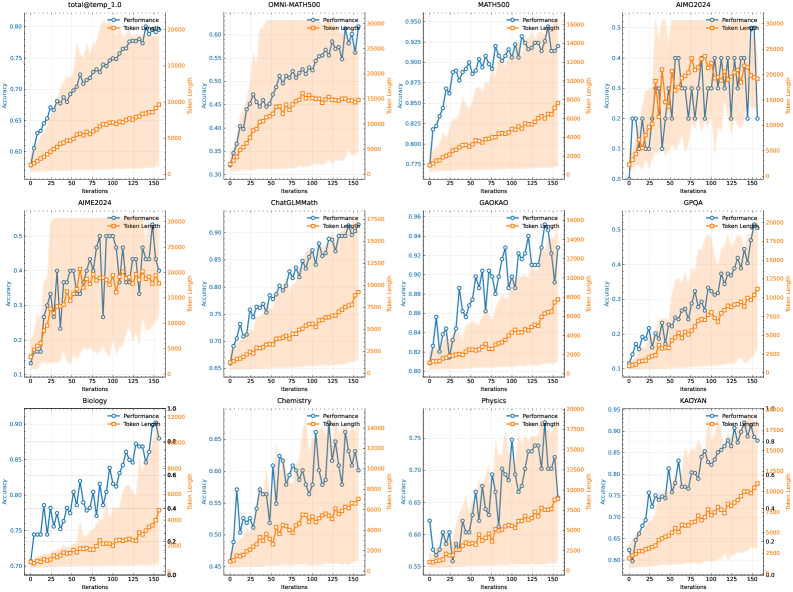
The image contains 12 line charts arranged in a 3x4 grid. Each chart displays the "Performance" (accuracy) and "Token Length" over "Iterations" for a specific dataset or model. The x-axis (Iterations) is consistent across all charts, while the y-axes (Accuracy and Token Length) vary in scale.
### Components/Axes
**General Chart Elements:**
* **X-axis:** "Iterations", ranging from 0 to 150 in increments of 25.
* **Left Y-axis:** "Accuracy", ranging from different minimums to maximums depending on the chart.
* **Right Y-axis:** "Token Length", ranging from different minimums to maximums depending on the chart.
* **Legend:** Located at the top of each chart.
* Blue line with circle markers: "Performance" (Accuracy)
* Orange line with square markers: "Token Length"
* Orange shaded area: Represents the variance in Token Length.
**Specific Chart Titles and Y-axis Ranges:**
1. **total@temp_1.0:**
* Accuracy: 0.60 to 0.80
* Token Length: 0 to 20000
2. **OMNI-MATH500:**
* Accuracy: 0.30 to 0.60
* Token Length: 0 to 30000
3. **MATH500:**
* Accuracy: 0.775 to 0.950
* Token Length: 0 to 16000
4. **AIM02024:**
* Accuracy: 0.0 to 0.5
* Token Length: 0 to 30000
5. **AIME2024:**
* Accuracy: 0.1 to 0.6
* Token Length: 0 to 30000
6. **ChatGLMMath:**
* Accuracy: 0.65 to 0.95
* Token Length: 0 to 17500
7. **GAOKAO:**
* Accuracy: 0.82 to 0.96
* Token Length: 0 to 16000
8. **GPQA:**
* Accuracy: 0.1 to 0.5
* Token Length: 0 to 20000
9. **Biology:**
* Accuracy: 0.70 to 1.0
* Token Length: 0 to 12000
10. **Chemistry:**
* Accuracy: 0.45 to 0.85
* Token Length: 0 to 14000
11. **Physics:**
* Accuracy: 0.55 to 0.75
* Token Length: 0 to 17500
12. **KAOYAN:**
* Accuracy: 0.60 to 0.95
* Token Length: 0 to 20000
### Detailed Analysis
**Chart 1: total@temp_1.0**
* **Performance:** Starts at approximately 0.60 and increases steadily to about 0.78.
* **Token Length:** Starts at approximately 2000 and increases steadily to about 12000.
**Chart 2: OMNI-MATH500**
* **Performance:** Starts at approximately 0.32 and increases to about 0.58, with some fluctuations.
* **Token Length:** Starts at approximately 2000 and increases steadily to about 27000.
**Chart 3: MATH500**
* **Performance:** Starts at approximately 0.78 and increases to about 0.94, with some fluctuations.
* **Token Length:** Starts at approximately 1000 and increases steadily to about 10000.
**Chart 4: AIM02024**
* **Performance:** Starts at approximately 0.12, increases sharply to about 0.4, then fluctuates between 0.3 and 0.5.
* **Token Length:** Starts at approximately 2000 and increases steadily to about 25000.
**Chart 5: AIME2024**
* **Performance:** Starts at approximately 0.12, increases sharply to about 0.45, then fluctuates between 0.35 and 0.5.
* **Token Length:** Starts at approximately 2000 and increases steadily to about 25000.
**Chart 6: ChatGLMMath**
* **Performance:** Starts at approximately 0.65 and increases steadily to about 0.92.
* **Token Length:** Starts at approximately 1000 and increases steadily to about 15000.
**Chart 7: GAOKAO**
* **Performance:** Starts at approximately 0.82 and increases to about 0.95, with some fluctuations.
* **Token Length:** Starts at approximately 1000 and increases steadily to about 12000.
**Chart 8: GPQA**
* **Performance:** Starts at approximately 0.1 and increases steadily to about 0.45, with some fluctuations.
* **Token Length:** Starts at approximately 1000 and increases steadily to about 17500.
**Chart 9: Biology**
* **Performance:** Starts at approximately 0.7 and increases steadily to about 0.9.
* **Token Length:** Starts at approximately 2000 and increases steadily to about 10000.
**Chart 10: Chemistry**
* **Performance:** Starts at approximately 0.45 and increases to about 0.8, with significant fluctuations.
* **Token Length:** Starts at approximately 1000 and increases steadily to about 12000.
**Chart 11: Physics**
* **Performance:** Starts at approximately 0.55 and increases to about 0.72, with some fluctuations.
* **Token Length:** Starts at approximately 1000 and increases steadily to about 15000.
**Chart 12: KAOYAN**
* **Performance:** Starts at approximately 0.6 and increases to about 0.92, with some fluctuations.
* **Token Length:** Starts at approximately 1000 and increases steadily to about 17500.
### Key Observations
* **General Trend:** In most charts, both "Performance" and "Token Length" tend to increase with "Iterations."
* **Fluctuations:** The "Performance" lines show more fluctuations compared to the "Token Length" lines.
* **Variance:** The orange shaded area around the "Token Length" line indicates the variance in token length across iterations.
* **Different Scales:** The scales of the y-axes vary significantly across the charts, indicating different ranges of performance and token length for each dataset/model.
### Interpretation
The charts illustrate the relationship between model performance (accuracy) and token length as the training process progresses through iterations. The general upward trend suggests that as the models are trained for more iterations, they tend to achieve higher accuracy and process longer sequences of tokens.
The fluctuations in the "Performance" lines could be attributed to various factors such as the inherent variability in the training data, the learning rate, or the model architecture. The steady increase in "Token Length" suggests that the models are gradually learning to handle longer sequences effectively.
The different scales and performance levels across the charts indicate that the models and datasets have varying characteristics and complexities. Some models/datasets (e.g., MATH500, GAOKAO) achieve higher accuracy compared to others (e.g., AIM02024, GPQA), suggesting that they might be easier to learn or better suited for the specific model architecture.
The variance in token length, represented by the shaded area, provides insights into the consistency of token length across iterations. A wider shaded area indicates greater variability, while a narrower area suggests more consistent token lengths.