\n
## Charts: Performance vs. Iterations for Various Benchmarks
### Overview
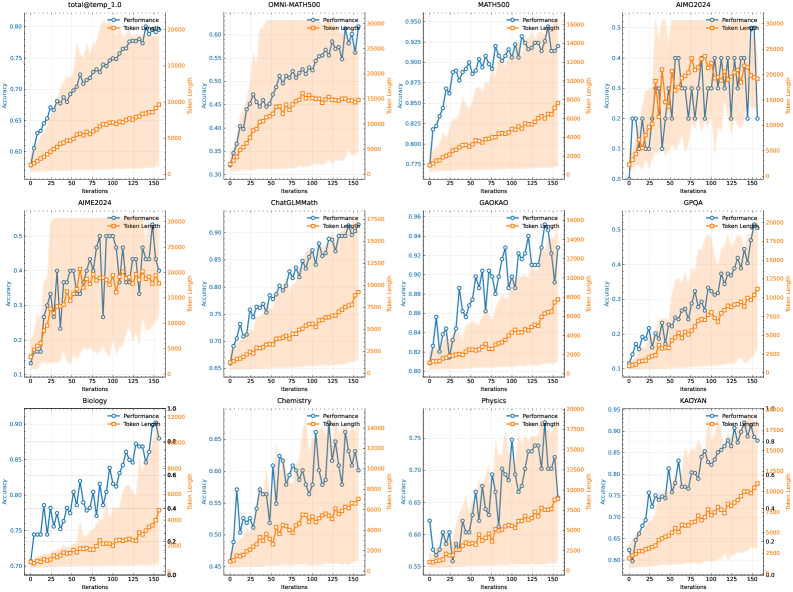
The image presents a 3x4 grid of line charts, each depicting the relationship between "Performance" (Accuracy) and "Token Length" against "Iterations" for different benchmarks. The benchmarks include Total@temp_1.0, OMNI-MATH500, MATH500, AIMO2024, AIME2024, ChatGLMMath, GAOKAO, GPQA, BZ2024, Biology, Chemistry, Physics, and KACYAN. Each chart has two y-axes: one for Accuracy (ranging approximately from 0.2 to 0.95) and one for Token Length (ranging approximately from 0 to 30000). The x-axis represents Iterations, ranging from 0 to 150.
### Components/Axes
* **X-axis (all charts):** Iterations (0 to 150)
* **Y-axis (left):** Accuracy (varying scales, approximately 0.2 to 0.95)
* **Y-axis (right):** Token Length (varying scales, approximately 0 to 30000)
* **Data Series (all charts):**
* Performance (Blue line with circle markers)
* Token Length (Orange line with square markers)
* **Chart Titles:** Each chart is labeled with the name of the benchmark.
* **Legend (top-left of each chart):** Indicates which line represents Performance and Token Length.
### Detailed Analysis or Content Details
Here's a breakdown of each chart, noting trends and approximate data points. Due to the image resolution, values are approximate.
1. **Total@temp_1.0:** Performance shows a generally increasing trend, starting around 0.75 and reaching approximately 0.88. Token Length increases steadily from 0 to around 20000.
2. **OMNI-MATH500:** Performance fluctuates between approximately 0.45 and 0.65. Token Length increases steadily from 0 to around 25000.
3. **MATH500:** Performance shows a slight increasing trend, starting around 0.82 and reaching approximately 0.90. Token Length increases steadily from 0 to around 15000.
4. **AIMO2024:** Performance fluctuates between approximately 0.2 and 0.5. Token Length increases steadily from 0 to around 30000.
5. **AIME2024:** Performance shows a generally increasing trend, starting around 0.5 and reaching approximately 0.7. Token Length increases steadily from 0 to around 20000.
6. **ChatGLMMath:** Performance fluctuates between approximately 0.65 and 0.85. Token Length increases steadily from 0 to around 17500.
7. **GAOKAO:** Performance shows a generally increasing trend, starting around 0.85 and reaching approximately 0.96. Token Length increases steadily from 0 to around 14000.
8. **GPQA:** Performance fluctuates between approximately 0.4 and 0.6. Token Length increases steadily from 0 to around 7500.
9. **BZ2024:** Performance fluctuates between approximately 0.7 and 0.85. Token Length increases steadily from 0 to around 20000.
10. **Biology:** Performance fluctuates between approximately 0.7 and 0.8. Token Length increases steadily from 0 to around 15000.
11. **Chemistry:** Performance fluctuates between approximately 0.7 and 0.85. Token Length increases steadily from 0 to around 20000.
12. **Physics:** Performance fluctuates between approximately 0.75 and 0.9. Token Length increases steadily from 0 to around 15000.
13. **KACYAN:** Performance shows a generally increasing trend, starting around 0.6 and reaching approximately 0.8. Token Length increases steadily from 0 to around 10000.
### Key Observations
* **Token Length consistently increases with Iterations:** Across all benchmarks, the Token Length shows a consistent upward trend, indicating that the model generates longer sequences as training progresses.
* **Performance varies significantly across benchmarks:** Some benchmarks (e.g., GAOKAO, MATH500) show a clear improvement in Performance with increasing Iterations, while others (e.g., AIMO2024, GPQA) exhibit more erratic behavior.
* **Correlation between Performance and Token Length is not always clear:** In some charts, Performance and Token Length appear to be positively correlated (both increase with Iterations), while in others, the relationship is less obvious.
* **Fluctuations in Performance:** Many charts show significant fluctuations in Performance, suggesting instability in the training process.
### Interpretation
The charts demonstrate the training dynamics of a model across a diverse set of benchmarks. The consistent increase in Token Length suggests the model is learning to generate more complex and detailed responses as it trains. However, the varying Performance trends indicate that the model's ability to improve differs significantly depending on the specific task. The fluctuations in Performance suggest that the training process may be sensitive to hyperparameters or data variations.
The benchmarks cover a range of domains (mathematics, reasoning, science, general knowledge), and the differences in performance suggest that the model may have varying strengths and weaknesses. For example, GAOKAO and MATH500 show relatively stable and positive performance trends, indicating that the model is effectively learning these tasks. Conversely, AIMO2024 and GPQA exhibit more erratic behavior, suggesting that these tasks may be more challenging or require different training strategies.
The relationship between Performance and Token Length is complex. While a longer Token Length might indicate a more detailed response, it doesn't necessarily guarantee higher Accuracy. It's possible that the model is generating verbose but irrelevant content, leading to a plateau or even a decrease in Performance. Further analysis would be needed to determine the optimal balance between Token Length and Accuracy for each benchmark.