## Chart Type: Combined Confusion Matrices and Bar Chart
### Overview
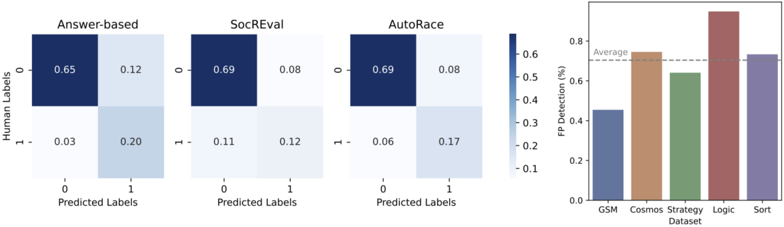
The image presents a combination of confusion matrices and a bar chart. The confusion matrices show the performance of three different models ("Answer-based", "SocREval", and "AutoRace") in predicting labels. The bar chart displays the False Positive (FP) detection rates (%) for different datasets ("GSM", "Cosmos", "Strategy", "Logic", and "Sort").
### Components/Axes
**Confusion Matrices (Left Side):**
* **Titles:** "Answer-based", "SocREval", "AutoRace" (placed above each matrix)
* **Axes:**
* Y-axis (vertical): "Human Labels" with values 0 and 1.
* X-axis (horizontal): "Predicted Labels" with values 0 and 1.
* **Cells:** Each cell contains a numerical value representing the proportion of predictions. The color of the cell corresponds to the value, with darker blue indicating higher values.
* **Color Scale:** A vertical color bar indicates the mapping between color and value, ranging from approximately 0.1 to 0.6.
**Bar Chart (Right Side):**
* **Title:** Implicitly represents FP Detection rates across different datasets.
* **Axes:**
* Y-axis (vertical): "FP Detection (%)" ranging from 0.0 to 0.8.
* X-axis (horizontal): "Dataset" with categories "GSM", "Cosmos", "Strategy", "Logic", and "Sort".
* **Bars:** Each bar represents the FP detection rate for a specific dataset.
* **Average Line:** A dashed horizontal line labeled "Average" is present at approximately 0.7.
### Detailed Analysis
**Confusion Matrices:**
* **Answer-based:**
* (0, 0): 0.65 (dark blue)
* (0, 1): 0.12 (light blue)
* (1, 0): 0.03 (very light blue)
* (1, 1): 0.20 (light blue)
* **SocREval:**
* (0, 0): 0.69 (dark blue)
* (0, 1): 0.08 (very light blue)
* (1, 0): 0.11 (light blue)
* (1, 1): 0.12 (light blue)
* **AutoRace:**
* (0, 0): 0.69 (dark blue)
* (0, 1): 0.08 (very light blue)
* (1, 0): 0.06 (very light blue)
* (1, 1): 0.17 (light blue)
**Bar Chart:**
* **GSM:** Approximately 0.45 (blue-gray)
* **Cosmos:** Approximately 0.75 (brown)
* **Strategy:** Approximately 0.63 (green)
* **Logic:** Approximately 0.90 (red-brown)
* **Sort:** Approximately 0.72 (purple)
### Key Observations
* The confusion matrices show that all three models ("Answer-based", "SocREval", and "AutoRace") perform well in predicting the '0' label, as indicated by the high values in the top-left cells.
* The "Logic" dataset has the highest FP detection rate, significantly above the average.
* The "GSM" dataset has the lowest FP detection rate.
* "Cosmos" and "Sort" datasets have similar FP detection rates, close to the average.
### Interpretation
The confusion matrices provide insights into the classification performance of the three models. The high values on the diagonal suggest that the models are generally accurate in their predictions. The bar chart highlights the variability in FP detection rates across different datasets. The "Logic" dataset's high FP detection rate could indicate that it is more challenging for the models to classify correctly, leading to more false positives. The "GSM" dataset, on the other hand, appears to be easier to classify. The average line provides a benchmark for comparing the performance of the models on different datasets.