\n
## Chart: Confusion Matrices and FP Detection Rates
### Overview
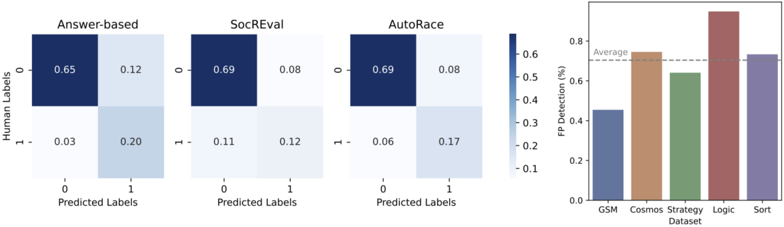
The image presents a comparison of model performance across three datasets (Answer-based, SocREval, AutoRace) using confusion matrices and a bar chart showing False Positive (FP) detection rates. The confusion matrices visualize the agreement between predicted labels and human labels, while the bar chart quantifies the FP detection rates for each dataset.
### Components/Axes
The image is divided into two main sections: three confusion matrices positioned horizontally on the left, and a bar chart on the right.
**Confusion Matrices:**
* **X-axis:** "Predicted Labels" with markers 0 and 1.
* **Y-axis:** "Human Labels" with markers 0 and 1.
* **Titles:** Each matrix is labeled with the dataset name: "Answer-based", "SocREval", and "AutoRace".
* **Color Scale:** A color bar on the right indicates the value mapping, ranging from approximately 0.1 (lightest blue) to 0.6 (darkest blue).
**Bar Chart:**
* **X-axis:** "Dataset" with labels: "GSM", "Cosmos", "Strategy", "Logic", "Sort".
* **Y-axis:** "FP Detection (%)" with a scale from 0.0 to 0.8.
* **Bars:** Represent the FP detection rate for each dataset.
* **Horizontal Line:** A dashed horizontal line is present at approximately 0.6.
* **Legend:** "Average" is indicated above the bar chart.
### Detailed Analysis or Content Details
**Confusion Matrices:**
* **Answer-based:**
* Human Label 0, Predicted Label 0: 0.65
* Human Label 0, Predicted Label 1: 0.12
* Human Label 1, Predicted Label 0: 0.03
* Human Label 1, Predicted Label 1: 0.20
* **SocREval:**
* Human Label 0, Predicted Label 0: 0.69
* Human Label 0, Predicted Label 1: 0.08
* Human Label 1, Predicted Label 0: 0.11
* Human Label 1, Predicted Label 1: 0.12
* **AutoRace:**
* Human Label 0, Predicted Label 0: 0.69
* Human Label 0, Predicted Label 1: 0.08
* Human Label 1, Predicted Label 0: 0.06
* Human Label 1, Predicted Label 1: 0.17
**Bar Chart:**
* GSM: Approximately 0.35
* Cosmos: Approximately 0.72
* Strategy: Approximately 0.55
* Logic: Approximately 0.90
* Sort: Approximately 0.65
### Key Observations
* All three confusion matrices show a strong diagonal dominance, indicating a generally good agreement between predicted and human labels. The highest values are consistently found where Human Label = Predicted Label.
* The FP detection rates vary significantly across datasets. Logic has the highest FP detection rate (approximately 0.90), while GSM has the lowest (approximately 0.35).
* The dashed line at 0.6 seems to serve as a threshold or benchmark for FP detection. Cosmos and Sort are above this line, while GSM and Strategy are below.
### Interpretation
The data suggests that the model performs reasonably well in aligning with human labels across all three datasets (Answer-based, SocREval, AutoRace), as evidenced by the dominant diagonal in the confusion matrices. However, the FP detection rates reveal substantial differences in performance depending on the dataset. The Logic dataset exhibits a particularly high rate of false positives, indicating that the model is frequently misclassifying instances in this dataset.
The variation in FP detection rates could be attributed to several factors, including the inherent difficulty of the dataset, the quality of the human labels, or the model's sensitivity to specific features within each dataset. The dashed line at 0.6 might represent a tolerable level of false positives, and the datasets exceeding this threshold (Cosmos and Sort) may require further investigation or model refinement.
The fact that the confusion matrices are similar across the three datasets suggests that the underlying model architecture or training procedure is consistent, and the differences in performance are primarily driven by the characteristics of the datasets themselves.