## Heatmap and Bar Chart: Model Performance and False Positive Detection
### Overview
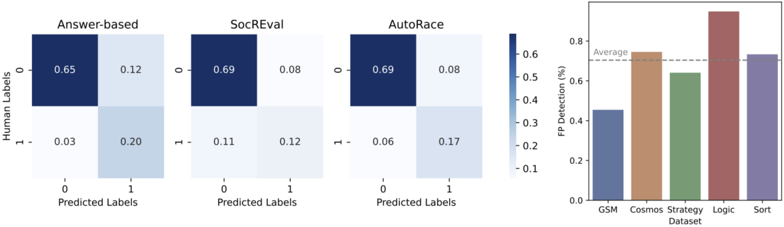
The image contains three confusion matrices (Answer-based, SocREval, AutoRace) and a bar chart comparing false positive (FP) detection rates across datasets (GSM, Cosmos, Strategy, Logic, Sort). The confusion matrices show model prediction accuracy, while the bar chart highlights FP detection percentages.
---
### Components/Axes
#### Confusion Matrices
- **X-axis (Predicted Labels)**: 0, 1 (binary classification)
- **Y-axis (Human Labels)**: 0, 1 (ground truth)
- **Values**: Proportions of predictions (e.g., 0.65 = 65% of predictions for class 0 when actual is 0)
- **Color Scale**: Dark blue (high values, ~0.8) to light gray (low values, ~0.1)
- **Matrices**:
1. **Answer-based**:
- TP (0→0): 0.65
- FP (0→1): 0.12
- FN (1→0): 0.03
- TN (1→1): 0.20
2. **SocREval**:
- TP (0→0): 0.69
- FP (0→1): 0.08
- FN (1→0): 0.11
- TN (1→1): 0.12
3. **AutoRace**:
- TP (0→0): 0.69
- FP (0→1): 0.08
- FN (1→0): 0.06
- TN (1→1): 0.17
#### Bar Chart
- **X-axis (Datasets)**: GSM, Cosmos, Strategy, Logic, Sort
- **Y-axis (FP Detection %)**: 0–0.8 (percentage scale)
- **Legend**:
- Blue: GSM (~0.45)
- Orange: Cosmos (~0.75)
- Green: Strategy (~0.65)
- Red: Logic (~0.85)
- Purple: Sort (~0.7)
- **Average Line**: Horizontal dashed line at 0.6%
---
### Detailed Analysis
#### Confusion Matrices
- **Answer-based**:
- Highest false negatives (FN = 0.03) but lowest false positives (FP = 0.12).
- Balanced true negatives (TN = 0.20) but lower true positives (TP = 0.65) compared to SocREval/AutoRace.
- **SocREval**:
- Highest true positives (TP = 0.69) and lowest false positives (FP = 0.08).
- Moderate false negatives (FN = 0.11) and low true negatives (TN = 0.12).
- **AutoRace**:
- Matches SocREval in TP (0.69) and FP (0.08).
- **Best performance** in false negatives (FN = 0.06) and true negatives (TN = 0.17).
#### Bar Chart
- **Logic Dataset**:
- **Highest FP detection** (~0.85), exceeding the average (0.6%).
- Suggests significant model struggles or dataset-specific challenges.
- **GSM Dataset**:
- **Lowest FP detection** (~0.45), below average.
- Indicates better model performance or easier dataset.
- **Cosmos, Sort, Strategy**:
- FP detection rates cluster around the average (0.6–0.75).
---
### Key Observations
1. **Model Performance**:
- SocREval and AutoRace outperform Answer-based in true positive rates.
- AutoRace excels in minimizing false negatives (FN = 0.06).
2. **Dataset Challenges**:
- Logic dataset has anomalously high FP detection (~0.85), suggesting potential data quality issues or model bias.
- GSM dataset shows the most reliable predictions (lowest FP).
---
### Interpretation
- **Model Comparison**:
- SocREval and AutoRace demonstrate superior accuracy, with AutoRace particularly strong in reducing false negatives. This could make it preferable for applications where missing positives is critical (e.g., medical diagnosis).
- **Dataset Impact**:
- The Logic dataset’s high FP rate implies it may contain noisy labels, ambiguous examples, or require specialized preprocessing. Conversely, GSM’s low FP rate suggests it is well-suited for current models.
- **FP Detection Trends**:
- The average FP detection (0.6%) serves as a benchmark. Logic’s performance is 41% above average, highlighting a critical outlier that warrants investigation.
---
### Recommendations
1. Investigate the Logic dataset for data quality issues or model-specific biases.
2. Prioritize AutoRace for tasks requiring high precision in negative class identification.
3. Use SocREval for balanced performance across metrics.