## Bar Chart: Best-of-8 Mean Accuracy
### Overview
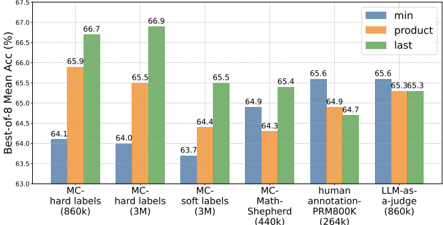
The image is a bar chart comparing the "Best-of-8 Mean Accuracy (%)" across different methods and datasets. The chart compares three different strategies ("min", "product", and "last") across six different datasets or methods.
### Components/Axes
* **Y-axis:** "Best-of-8 Mean Acc (%)", ranging from 63.0 to 67.5 with increments of 0.5.
* **X-axis:** Categorical axis representing different methods/datasets:
* MC-hard labels (860k)
* MC-hard labels (3M)
* MC-soft labels (3M)
* MC-Math-Shepherd (440k)
* human annotation-PRM800K (264k)
* LLM-as-a-judge (860k)
* **Legend:** Located at the top-right of the chart.
* Blue: "min"
* Orange: "product"
* Green: "last"
### Detailed Analysis
Here's a breakdown of the data for each category:
1. **MC-hard labels (860k):**
* min (Blue): 64.1%
* product (Orange): 65.9%
* last (Green): 66.7%
Trend: The accuracy increases from "min" to "product" to "last".
2. **MC-hard labels (3M):**
* min (Blue): 64.0%
* product (Orange): 65.5%
* last (Green): 66.9%
Trend: The accuracy increases from "min" to "product" to "last".
3. **MC-soft labels (3M):**
* min (Blue): 63.7%
* product (Orange): 64.4%
* last (Green): 65.5%
Trend: The accuracy increases from "min" to "product" to "last".
4. **MC-Math-Shepherd (440k):**
* min (Blue): 64.3%
* product (Orange): 64.9%
* last (Green): 65.4%
Trend: The accuracy increases from "min" to "product" to "last".
5. **human annotation-PRM800K (264k):**
* min (Blue): 65.6%
* product (Orange): 64.9%
* last (Green): 64.7%
Trend: The accuracy decreases from "min" to "product" to "last".
6. **LLM-as-a-judge (860k):**
* min (Blue): 65.6%
* product (Orange): 65.3%
* last (Green): 65.3%
Trend: The accuracy decreases slightly from "min" to "product" and remains the same for "last".
### Key Observations
* The "last" strategy generally yields the highest accuracy for the first four datasets.
* For "human annotation-PRM800K (264k)", the "min" strategy has the highest accuracy.
* The "min" strategy consistently has the lowest accuracy for the first four datasets.
* The "LLM-as-a-judge (860k)" dataset shows relatively similar accuracy across all three strategies.
### Interpretation
The chart suggests that the "last" strategy is generally more effective for the "MC-" datasets, while the "min" strategy performs better for the "human annotation-PRM800K (264k)" dataset. The "LLM-as-a-judge (860k)" dataset seems to be less sensitive to the choice of strategy. This could indicate that the nature of the dataset or the evaluation method interacts differently with each strategy. The performance differences between the strategies highlight the importance of selecting an appropriate strategy based on the specific dataset and task.