## Bar Chart: Best-of-8 Mean Accuracy Comparison
### Overview
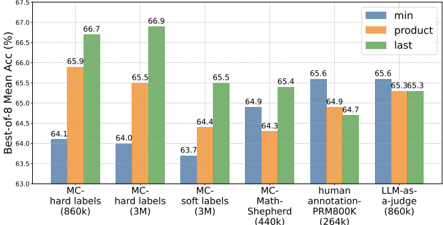
This bar chart compares the Best-of-8 Mean Accuracy (%) for different models/datasets using three different methods: 'min', 'product', and 'last'. The x-axis represents the model/dataset, and the y-axis represents the accuracy percentage. Each model/dataset has three bars representing the accuracy achieved by each method.
### Components/Axes
* **X-axis:** Model/Dataset. Categories are: MC-hard labels (860k), MC-hard labels (3M), MC-soft labels (3M), MC-Math-Shepherd (440k), human annotation-PRM800k (264k), LLM-as-a-judge (860k). The numbers in parentheses indicate the dataset size (in 'k' - thousands).
* **Y-axis:** Best-of-8 Mean Acc (%). Scale ranges from approximately 61% to 67.5%.
* **Legend:**
* Blue: 'min'
* Orange: 'product'
* Green: 'last'
### Detailed Analysis
Let's analyze each model/dataset and the accuracy achieved by each method:
1. **MC-hard labels (860k):**
* 'min': Approximately 64.1%
* 'product': Approximately 65.9%
* 'last': Approximately 66.7%
* Trend: Accuracy increases from 'min' to 'product' to 'last'.
2. **MC-hard labels (3M):**
* 'min': Approximately 64.0%
* 'product': Approximately 65.5%
* 'last': Approximately 66.9%
* Trend: Accuracy increases from 'min' to 'product' to 'last'.
3. **MC-soft labels (3M):**
* 'min': Approximately 63.7%
* 'product': Approximately 64.4%
* 'last': Approximately 65.5%
* Trend: Accuracy increases from 'min' to 'product' to 'last'.
4. **MC-Math-Shepherd (440k):**
* 'min': Approximately 64.3%
* 'product': Approximately 64.9%
* 'last': Approximately 65.4%
* Trend: Accuracy increases from 'min' to 'product' to 'last'.
5. **human annotation-PRM800k (264k):**
* 'min': Approximately 65.6%
* 'product': Approximately 64.9%
* 'last': Approximately 64.7%
* Trend: Accuracy decreases from 'min' to 'product' to 'last'.
6. **LLM-as-a-judge (860k):**
* 'min': Approximately 65.6%
* 'product': Approximately 65.3%
* 'last': Approximately 65.6%
* Trend: 'min' and 'last' are approximately equal, and 'product' is slightly lower.
### Key Observations
* For most models/datasets (MC-hard labels, MC-soft labels, MC-Math-Shepherd), the 'last' method consistently achieves the highest accuracy.
* The 'min' method generally yields the lowest accuracy.
* The human annotation dataset shows an unusual trend where 'min' performs best, and 'last' performs worst.
* The LLM-as-a-judge dataset shows relatively consistent performance across all three methods.
* The dataset size appears to influence the accuracy, but the relationship isn't straightforward.
### Interpretation
The chart demonstrates the performance of different methods ('min', 'product', 'last') in evaluating models trained on various datasets. The consistent superiority of the 'last' method for most datasets suggests that the final output or prediction of a model is often more accurate than earlier stages or intermediate results. The anomaly observed with the human annotation dataset could indicate that human judgments are less sensitive to the order of information or that the annotation process itself introduces a bias. The LLM-as-a-judge dataset's consistent performance suggests that LLMs can provide relatively stable and reliable evaluations. The varying dataset sizes (860k, 3M, 440k, 264k) suggest that larger datasets don't always guarantee higher accuracy, and the specific characteristics of the dataset play a crucial role. The chart highlights the importance of selecting the appropriate evaluation method based on the specific model and dataset being used.