## Grouped Bar Chart: Best-of-5 Mean Accuracy Comparison
### Overview
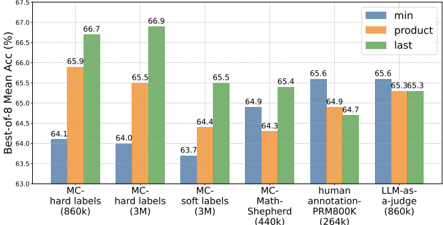
The image displays a grouped bar chart comparing the "Best-of-5 Mean Accuracy (%)" across six different methods or datasets. Each method is evaluated using three distinct metrics: "min", "product", and "last". The chart is designed to compare the performance of these evaluation strategies across various training or annotation paradigms.
### Components/Axes
* **Chart Type:** Grouped Bar Chart.
* **Y-Axis:**
* **Label:** "Best-of-5 Mean Acc (%)"
* **Scale:** Linear, ranging from 63.0 to 67.5.
* **Major Ticks:** 63.0, 63.5, 64.0, 64.5, 65.0, 65.5, 66.0, 66.5, 67.0, 67.5.
* **X-Axis (Categories):** Six distinct categories are listed from left to right:
1. `MC-hard labels (860k)`
2. `MC-hard labels (3M)`
3. `MC-soft labels (3M)`
4. `MC-Math-Shepherd (3M)`
5. `human-annotation-PRM800K (860k)`
6. `LLM-as-a-judge (860k)`
* **Legend:** Located in the top-right corner of the chart area.
* **Blue Bar:** `min`
* **Orange Bar:** `product`
* **Green Bar:** `last`
### Detailed Analysis
The following table reconstructs the approximate numerical values for each bar, based on visual alignment with the y-axis grid lines. Values are reported to one decimal place.
| Category (X-Axis) | `min` (Blue) | `product` (Orange) | `last` (Green) |
| :--- | :--- | :--- | :--- |
| **MC-hard labels (860k)** | 64.1 | 65.9 | 66.7 |
| **MC-hard labels (3M)** | 64.0 | 65.5 | 66.9 |
| **MC-soft labels (3M)** | 63.7 | 64.4 | 65.5 |
| **MC-Math-Shepherd (3M)** | 64.9 | 64.3 | 65.4 |
| **human-annotation-PRM800K (860k)** | 65.6 | 64.9 | 64.7 |
| **LLM-as-a-judge (860k)** | 65.6 | 65.3 | 65.3 |
**Trend Verification per Category:**
* **MC-hard labels (860k & 3M):** Clear ascending trend from `min` to `product` to `last`. The `last` metric performs best.
* **MC-soft labels (3M):** Ascending trend (`min` < `product` < `last`).
* **MC-Math-Shepherd (3M):** Non-monotonic trend. `min` (64.9) is higher than `product` (64.3), with `last` (65.4) being the highest.
* **human-annotation-PRM800K (860k):** Descending trend. `min` (65.6) is the highest, followed by `product` (64.9), and then `last` (64.7). This is the only category where `min` is the top performer.
* **LLM-as-a-judge (860k):** `min` (65.6) is slightly higher than `product` and `last`, which are tied at 65.3.
### Key Observations
1. **Dominance of `last`:** The `last` metric (green bar) achieves the highest accuracy in four out of six categories, with a peak of 66.9% for `MC-hard labels (3M)`.
2. **Performance of `min`:** The `min` metric (blue bar) shows the most variance. It is the lowest performer in the first three categories but becomes the highest performer in the `human-annotation` and `LLM-as-a-judge` categories.
3. **Category Performance:** The `MC-hard labels` methods (both 860k and 3M) achieve the highest overall accuracy values on the chart (up to 66.9%). The `MC-soft labels` method shows the lowest overall performance, with its highest bar (`last`) at 65.5%.
4. **Notable Anomaly:** The `human-annotation-PRM800K (860k)` category breaks the common pattern. It is the only category where the `min` metric outperforms both `product` and `last`.
### Interpretation
This chart likely compares different methods for training or evaluating a model on a multiple-choice (MC) task, possibly in mathematics or reasoning, given the "Math-Shepherd" and "PRM800K" references. The numbers in parentheses (860k, 3M) probably denote the size of the training or annotation dataset.
The three metrics (`min`, `product`, `last`) appear to be different strategies for aggregating or selecting from a set of model outputs ("Best-of-5"). The consistent superiority of the `last` strategy in most categories suggests that using the probability or score of the final generated token is a robust method for this evaluation. The reversal of this trend in the `human-annotation` category is significant. It implies that when the ground truth labels come from human annotation (as opposed to methods like `MC-hard` or `LLM-as-a-judge`), a different aggregation strategy (`min`) becomes more effective. This could indicate a difference in the quality, noise, or distribution of human-generated labels compared to machine-generated or heuristic-based labels.
The overall high performance of the `MC-hard labels` methods suggests that this particular training paradigm, especially with a larger dataset (3M), is highly effective for the task being measured. The chart provides a clear empirical basis for choosing both a training method (`MC-hard labels`) and an evaluation aggregation strategy (`last`) to maximize accuracy, while also highlighting that the optimal strategy may depend on the source of the evaluation data.