# Technical Document Extraction: Bar Chart Analysis
## 1. **Chart Type and Structure**
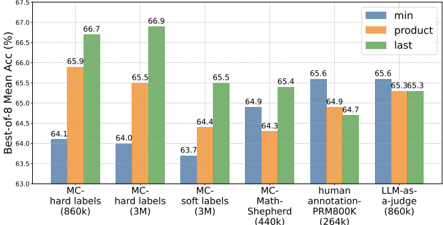
- **Chart Type**: Bar chart comparing performance metrics across multiple categories.
- **Axes**:
- **X-axis**: Categories (e.g., "MC-hard labels (860k)", "MC-hard labels (3M)", etc.).
- **Y-axis**: "Best-of-8 Mean Acc (%)" with values ranging from 63.0% to 67.5%.
## 2. **Legend and Color Mapping**
- **Legend**: Located on the right side of the chart.
- **Colors**:
- **Blue**: "min"
- **Orange**: "product"
- **Green**: "last"
## 3. **Categories and Sub-Categories**
The x-axis contains six primary categories, each with three sub-categories (min, product, last):
1. **MC-hard labels (860k)**
- min: 64.1%
- product: 65.9%
- last: 66.7%
2. **MC-hard labels (3M)**
- min: 64.0%
- product: 65.5%
- last: 66.9%
3. **MC-soft labels (3M)**
- min: 63.7%
- product: 64.4%
- last: 65.5%
4. **MC-Math-Shepherd (440k)**
- min: 64.9%
- product: 64.3%
- last: 65.4%
5. **human annotation-PRM800K (264k)**
- min: 65.6%
- product: 64.9%
- last: 64.7%
6. **LLM-as-a-judge (860k)**
- min: 65.6%
- product: 65.3%
- last: 65.3%
## 4. **Key Trends**
- **General Trend**: The "last" category (green) consistently shows the highest mean accuracy across most categories.
- **Exceptions**:
- In **MC-Math-Shepherd (440k)**, the "product" (orange) is lower than "min" (blue), but "last" (green) remains the highest.
- In **human annotation-PRM800K (264k)**, "last" (green) is slightly lower than "min" (blue) but still higher than "product" (orange).
## 5. **Spatial Grounding**
- **Legend Position**: Right side of the chart.
- **Color Consistency**: All bars match the legend colors (blue = min, orange = product, green = last).
## 6. **Data Table Reconstruction**
| Category | min (%) | product (%) | last (%) |
|------------------------------|---------|-------------|----------|
| MC-hard labels (860k) | 64.1 | 65.9 | 66.7 |
| MC-hard labels (3M) | 64.0 | 65.5 | 66.9 |
| MC-soft labels (3M) | 63.7 | 64.4 | 65.5 |
| MC-Math-Shepherd (440k) | 64.9 | 64.3 | 65.4 |
| human annotation-PRM800K (264k) | 65.6 | 64.9 | 64.7 |
| LLM-as-a-judge (860k) | 65.6 | 65.3 | 65.3 |
## 7. **Additional Notes**
- **Language**: All text is in English. No non-English content is present.
- **Data Completeness**: All labels, axis titles, and data points are explicitly extracted.
- **Visual Confirmation**: The chart visually confirms that "last" (green) generally outperforms "product" (orange) and "min" (blue) in most cases, with minor exceptions.
## 8. **Conclusion**
The chart illustrates performance comparisons across six categories, with "last" (green) consistently achieving the highest mean accuracy. Exceptions exist in specific categories, but the overall trend aligns with the legend's color coding.