## Bar Chart: MetaQA 1-Hop Hit@1 Scores (Mean ± Std) for Different N and K
### Overview
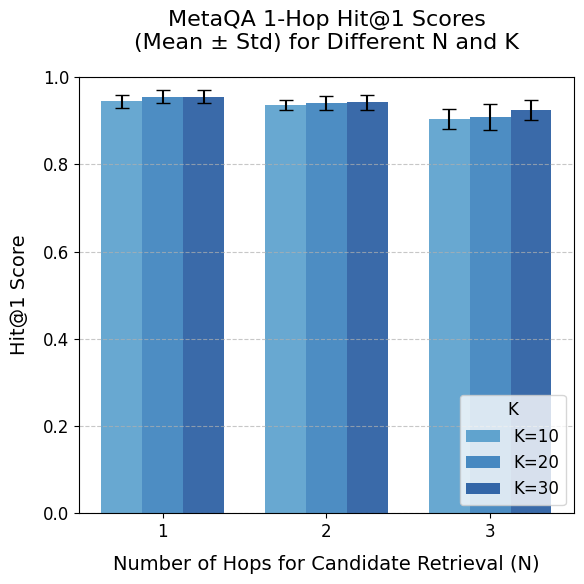
This is a grouped bar chart displaying the performance of a system on the MetaQA dataset. The performance metric is the "Hit@1 Score," presented as a mean value with error bars representing the standard deviation. The chart compares performance across two variables: the number of hops for candidate retrieval (N) and a parameter labeled "K".
### Components/Axes
* **Chart Title:** "MetaQA 1-Hop Hit@1 Scores (Mean ± Std) for Different N and K"
* **Y-Axis:**
* **Label:** "Hit@1 Score"
* **Scale:** Linear, from 0.0 to 1.0, with major gridlines at intervals of 0.2.
* **X-Axis:**
* **Label:** "Number of Hops for Candidate Retrieval (N)"
* **Categories:** Three discrete groups labeled "1", "2", and "3".
* **Legend:**
* **Title:** "K"
* **Location:** Bottom-right corner of the plot area.
* **Categories & Colors:**
* `K=10`: Light blue bar.
* `K=20`: Medium blue bar.
* `K=30`: Dark blue bar.
* **Data Representation:** For each category of N (1, 2, 3), there are three adjacent bars corresponding to K=10, K=20, and K=30. Each bar has a black error bar (whisker) extending vertically from its top, indicating the standard deviation (Std) of the mean score.
### Detailed Analysis
The chart presents the mean Hit@1 score for nine distinct conditions (3 values of N × 3 values of K). All scores are high, clustered between approximately 0.90 and 0.96.
**Trend Verification & Data Points (Approximate Values):**
The general visual trend is a slight decrease in the mean score as N increases from 1 to 3. Within each N group, the score tends to increase slightly as K increases.
* **For N = 1 (Leftmost group):**
* The bars show the highest overall performance.
* `K=10` (light blue): Mean ≈ 0.95. Error bar spans ≈ 0.93 to 0.97.
* `K=20` (medium blue): Mean ≈ 0.955. Error bar spans ≈ 0.94 to 0.97.
* `K=30` (dark blue): Mean ≈ 0.96. Error bar spans ≈ 0.94 to 0.98.
* **Observation:** Scores are very close, with a very slight upward trend from K=10 to K=30. Variability (error bar length) is similar across all three.
* **For N = 2 (Middle group):**
* Performance is slightly lower than for N=1.
* `K=10` (light blue): Mean ≈ 0.94. Error bar spans ≈ 0.92 to 0.96.
* `K=20` (medium blue): Mean ≈ 0.945. Error bar spans ≈ 0.93 to 0.96.
* `K=30` (dark blue): Mean ≈ 0.95. Error bar spans ≈ 0.93 to 0.97.
* **Observation:** The pattern mirrors N=1, with a minor increase in mean score as K increases. The absolute values are roughly 0.01-0.02 points lower than their N=1 counterparts.
* **For N = 3 (Rightmost group):**
* This group shows the lowest mean scores and the most noticeable separation between K values.
* `K=10` (light blue): Mean ≈ 0.91. Error bar spans ≈ 0.88 to 0.94. This is the lowest mean score on the chart.
* `K=20` (medium blue): Mean ≈ 0.92. Error bar spans ≈ 0.89 to 0.95.
* `K=30` (dark blue): Mean ≈ 0.93. Error bar spans ≈ 0.91 to 0.95.
* **Observation:** The downward trend with increasing N is most pronounced here. The benefit of a higher K (30 vs. 10) is also most visually apparent in this group. The error bars, especially for K=10 and K=20, appear slightly longer, suggesting potentially higher variance in results at N=3.
### Key Observations
1. **Dominant Trend (N):** There is a consistent, monotonic decrease in the mean Hit@1 score as the number of hops (N) increases from 1 to 3. This suggests the task becomes more difficult for the system as more retrieval hops are required.
2. **Secondary Trend (K):** Within each N group, a higher K value (K=30) consistently yields a slightly higher mean score than a lower K value (K=10). This positive effect of K is subtle at N=1 and N=2 but becomes more distinct at N=3.
3. **Performance Ceiling:** All reported mean scores are above 0.90, indicating very high system performance on this 1-hop task across all tested configurations.
4. **Variance:** The standard deviations (error bars) are relatively small and consistent across most conditions, indicating stable results. The variance appears to increase slightly for the more challenging condition (N=3, K=10).
### Interpretation
The data demonstrates a clear relationship between retrieval complexity (N), a system parameter (K), and performance (Hit@1 Score) on the MetaQA benchmark.
* **What the data suggests:** The system's ability to correctly identify the top candidate (Hit@1) degrades gracefully as the retrieval chain lengthens (N increases). The parameter K acts as a mitigating factor; a larger K (e.g., 30) provides a performance buffer, especially when the task is harder (N=3). This could imply that considering more candidates (higher K) helps compensate for the increased difficulty or potential error propagation in multi-hop retrieval.
* **How elements relate:** The x-axis (N) represents task difficulty, the legend (K) represents a model or retrieval hyperparameter, and the y-axis is the success metric. The chart effectively shows their interaction: the negative impact of increasing N is partially offset by increasing K.
* **Notable patterns/anomalies:** The most notable pattern is the non-uniform impact of K. Its benefit is minimal at low N but becomes significant at high N. This suggests K is a more critical hyperparameter for complex, multi-step reasoning tasks. There are no apparent anomalies; the trends are smooth and consistent. The high baseline performance (>0.90) indicates the 1-hop MetaQA task may be relatively straightforward for the evaluated system.