## Bar Chart: MetaQA 1-Hop Hit@1 Scores (Mean ± Std) for Different N and K
### Overview
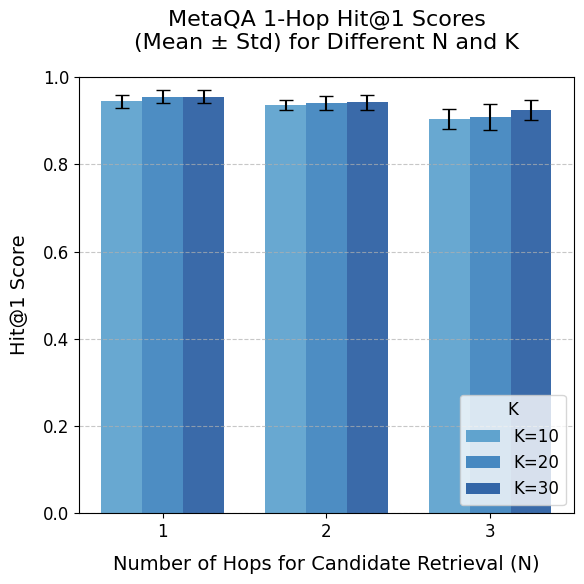
The chart compares the performance of a retrieval system (MetaQA) across three configurations: varying the number of hops for candidate retrieval (N = 1, 2, 3) and the number of candidates considered (K = 10, 20, 30). Scores are reported as mean Hit@1 with standard deviation error bars.
### Components/Axes
- **X-axis**: "Number of Hops for Candidate Retrieval (N)" with categories 1, 2, 3.
- **Y-axis**: "Hit@1 Score" scaled from 0.0 to 1.0.
- **Legend**: Located at the bottom-right, mapping colors to K values:
- Light blue: K=10
- Medium blue: K=20
- Dark blue: K=30
- **Bars**: Grouped by N, with three bars per category (one per K value). Error bars represent standard deviation.
### Detailed Analysis
- **N=1**:
- K=10: ~0.95 (±0.02)
- K=20: ~0.94 (±0.02)
- K=30: ~0.93 (±0.02)
- **N=2**:
- K=10: ~0.93 (±0.02)
- K=20: ~0.92 (±0.02)
- K=30: ~0.91 (±0.02)
- **N=3**:
- K=10: ~0.90 (±0.02)
- K=20: ~0.89 (±0.02)
- K=30: ~0.88 (±0.02)
### Key Observations
1. **Consistent Decline with Increasing K**: For all N values, Hit@1 scores decrease slightly as K increases (e.g., K=10 to K=30 drops ~0.05–0.07).
2. **Minimal Impact of N**: Scores remain relatively stable across N=1, 2, 3, with only minor reductions as N increases.
3. **Low Variability**: Error bars are small (~±0.02), indicating consistent performance across trials.
### Interpretation
The data suggests that increasing the number of candidates (K) marginally reduces retrieval effectiveness, likely due to dilution of high-quality candidates in larger pools. However, the system maintains high performance (scores >0.88) across all configurations, indicating robustness. The minimal impact of N implies that extending the number of hops does not significantly degrade performance, possibly due to effective candidate filtering. The error bars confirm reliability, as no configuration shows statistically significant divergence.