## Histogram: Sentences per Trace
### Overview
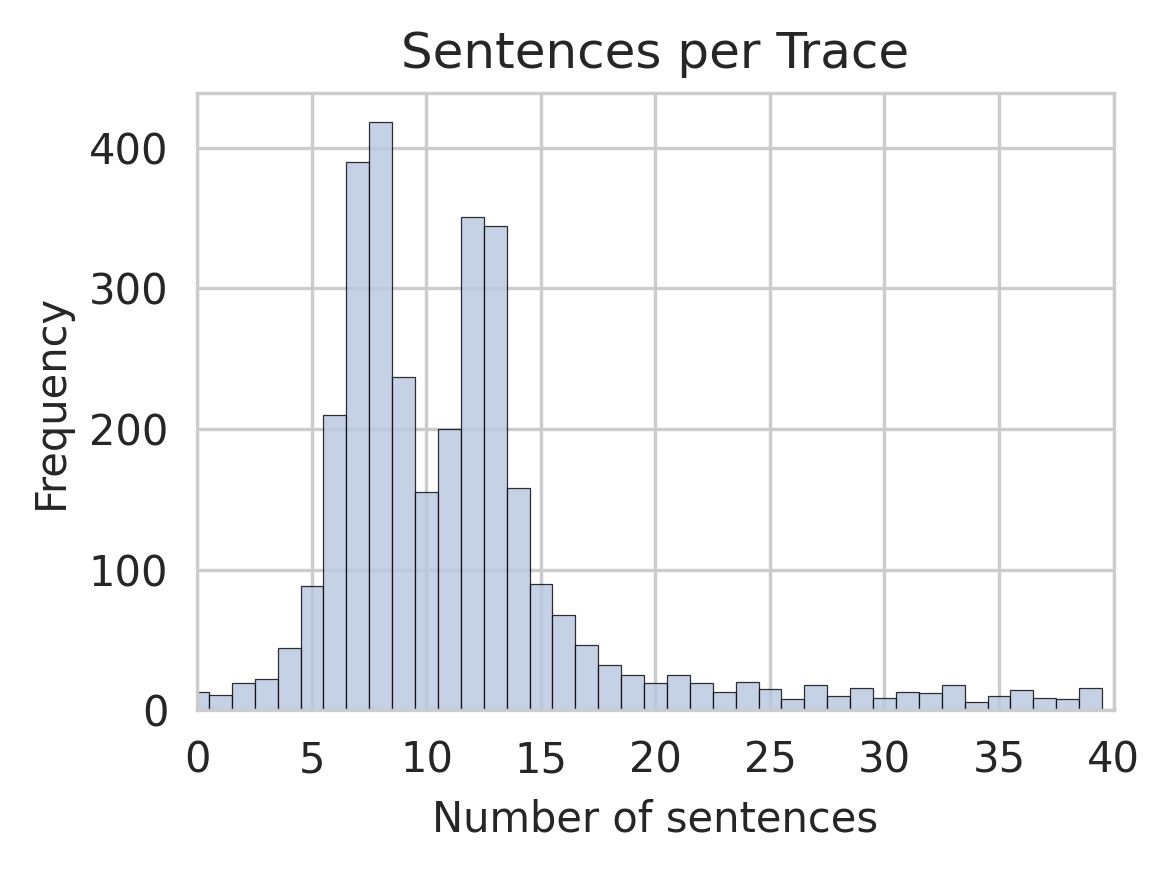
The image is a histogram showing the distribution of the number of sentences per trace. The x-axis represents the number of sentences, and the y-axis represents the frequency (count) of traces with that number of sentences. The histogram shows two distinct peaks, suggesting two common ranges for the number of sentences per trace.
### Components/Axes
* **Title:** Sentences per Trace
* **X-axis:** Number of sentences
* Scale: 0 to 40, with tick marks at intervals of 5 (0, 5, 10, 15, 20, 25, 30, 35, 40)
* **Y-axis:** Frequency
* Scale: 0 to 400, with tick marks at intervals of 100 (0, 100, 200, 300, 400)
* **Bars:** Light blue with dark blue outlines.
### Detailed Analysis
The histogram bars represent the frequency of traces for each number of sentences. Here's a breakdown of the approximate frequencies for different sentence ranges:
* **0-5 sentences:** Frequency gradually increases from approximately 10 to 210.
* **5-10 sentences:** Frequency rapidly increases to a peak of approximately 410 around 8 sentences, then decreases to approximately 150 around 10 sentences.
* **10-15 sentences:** Frequency increases again to a second peak of approximately 350 around 13 sentences, then decreases to approximately 80 around 15 sentences.
* **15-20 sentences:** Frequency continues to decrease to approximately 20.
* **20-40 sentences:** Frequency remains relatively low, fluctuating between approximately 10 and 20.
### Key Observations
* The distribution is bimodal, with peaks around 8 and 13 sentences.
* The frequency is highest for traces with around 8 sentences.
* The frequency decreases significantly for traces with more than 15 sentences.
* There are very few traces with a very low number of sentences (0-5).
### Interpretation
The histogram suggests that there are two common lengths for traces, one around 8 sentences and another around 13 sentences. The higher peak at 8 sentences indicates that this length is more frequent. The low frequency of traces with very few sentences suggests that most traces contain a reasonable number of sentences. The rapid decrease in frequency after 15 sentences indicates that longer traces are less common. This information could be useful for understanding the characteristics of the traces and for optimizing processes that use them.