## Scatter Plot: Prompt Distribution
### Overview
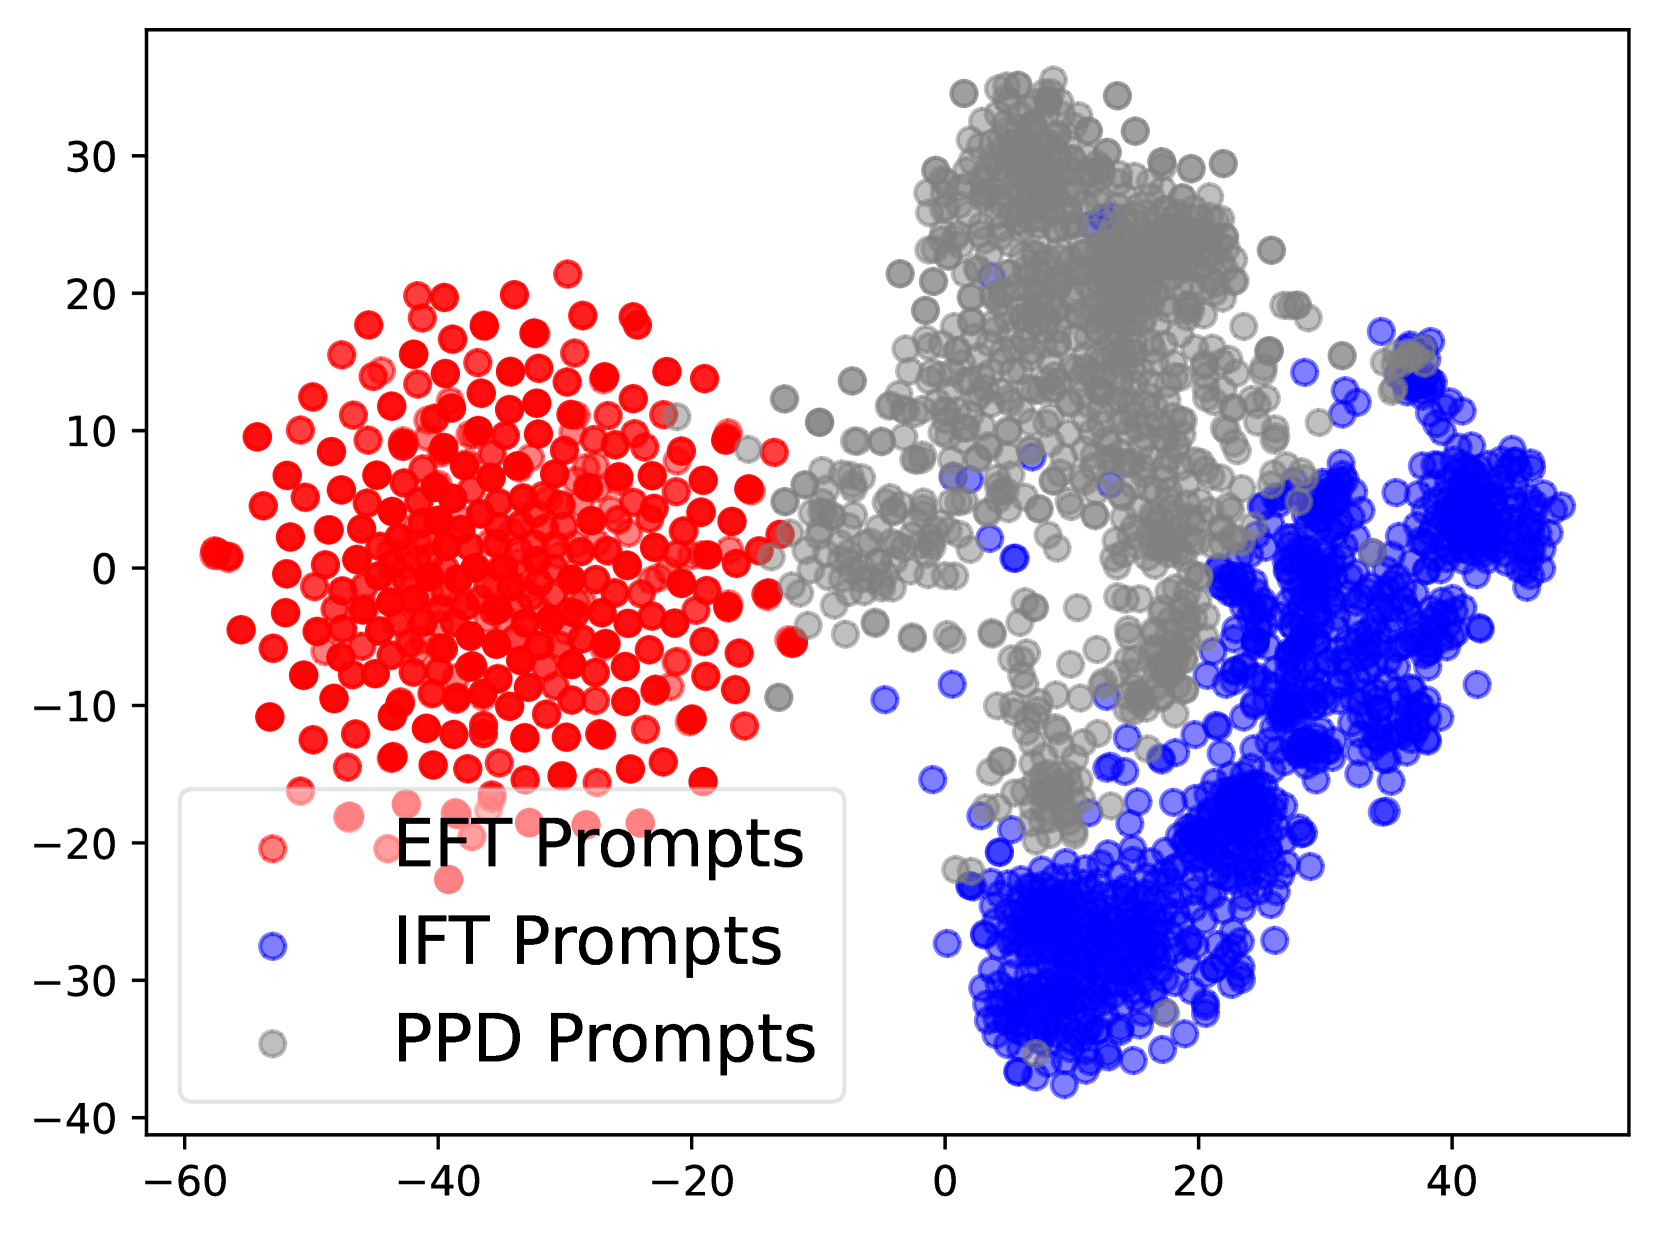
The image is a scatter plot visualizing the distribution of three types of prompts: EFT Prompts (red), IFT Prompts (blue), and PPD Prompts (gray). The plot shows the relative positioning of these prompts in a two-dimensional space, likely derived from a dimensionality reduction technique.
### Components/Axes
* **X-axis:** No explicit label is provided, but the range spans from approximately -60 to 40.
* **Y-axis:** No explicit label is provided, but the range spans from approximately -40 to 30.
* **Legend:** Located in the bottom-left corner, it identifies the three prompt types:
* EFT Prompts: Red
* IFT Prompts: Blue
* PPD Prompts: Gray
### Detailed Analysis
* **EFT Prompts (Red):** These prompts are clustered primarily in the left side of the plot. The cluster is centered around x = -40 and y = 0, with a spread from x = -60 to -20 and y = -20 to 20.
* **IFT Prompts (Blue):** These prompts are clustered primarily in the bottom-right side of the plot. The cluster is centered around x = 30 and y = -25, with a spread from x = 0 to 40 and y = -40 to 10.
* **PPD Prompts (Gray):** These prompts are clustered primarily in the top-right side of the plot. The cluster is centered around x = 10 and y = 15, with a spread from x = 0 to 40 and y = 0 to 30. There is some overlap with the IFT Prompts.
### Key Observations
* The three prompt types form distinct clusters, suggesting they occupy different regions in the feature space.
* There is some overlap between the PPD Prompts and IFT Prompts, indicating some similarity or shared characteristics.
* The EFT Prompts are the most isolated cluster, showing the least overlap with the other two types.
### Interpretation
The scatter plot visualizes the relationships between different types of prompts. The clustering suggests that the prompts have distinct characteristics that differentiate them. The proximity of the PPD and IFT Prompts might indicate that they share some underlying features or are used in similar contexts. The isolation of the EFT Prompts suggests they are more unique compared to the other two. The plot likely represents a projection of high-dimensional data into two dimensions, allowing for visual inspection of the prompt distributions.