## Scatter Plot: Prompt Type Distribution
### Overview
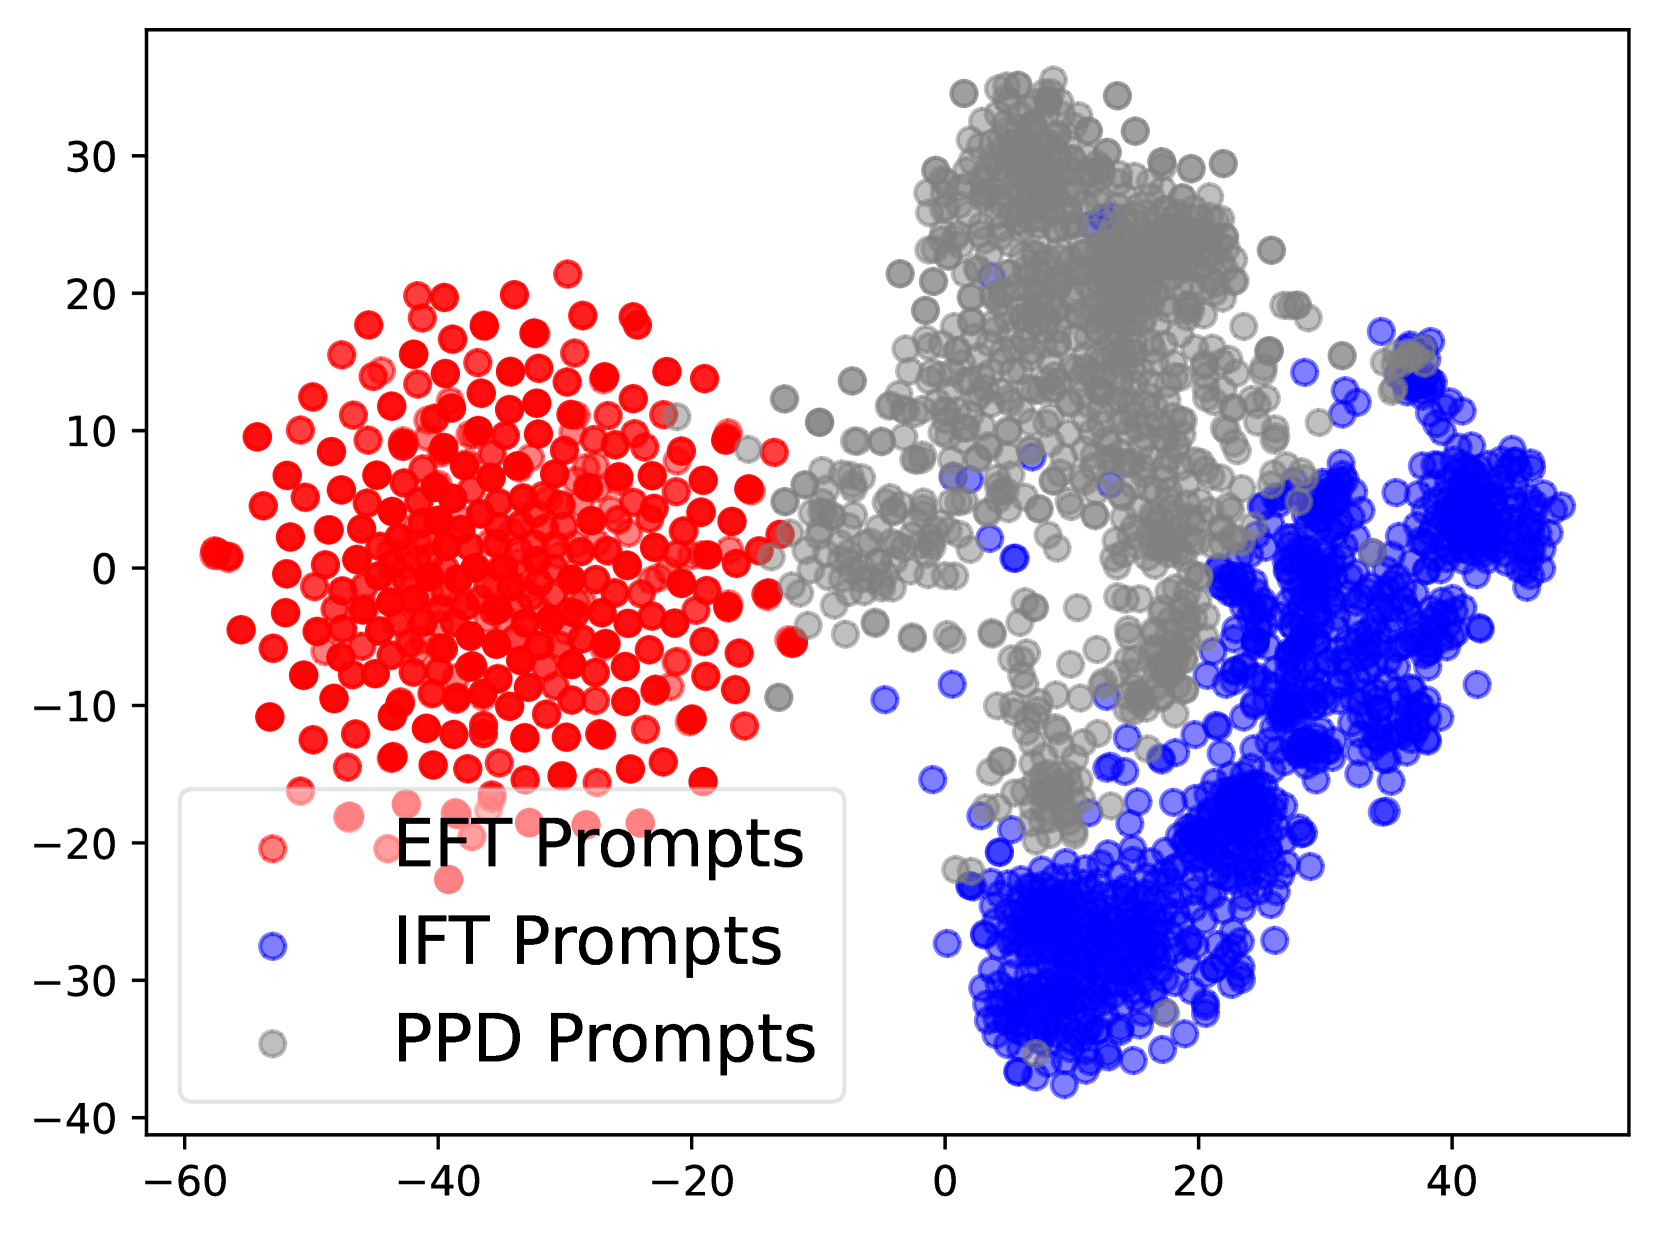
The image is a 2D scatter plot visualizing the distribution of three distinct categories of prompts, likely in a feature space derived from dimensionality reduction (e.g., t-SNE or PCA). The plot shows clear clustering and separation between the categories, with some overlap in specific regions.
### Components/Axes
* **Chart Type:** Scatter Plot
* **X-Axis:** Numerical scale ranging from approximately -65 to +50. Major tick marks are labeled at intervals of 20: -60, -40, -20, 0, 20, 40.
* **Y-Axis:** Numerical scale ranging from approximately -40 to +35. Major tick marks are labeled at intervals of 10: -40, -30, -20, -10, 0, 10, 20, 30.
* **Legend:** Located in the bottom-left quadrant of the plot area. It contains three entries:
1. **EFT Prompts:** Represented by a red circle (●).
2. **IFT Prompts:** Represented by a blue circle (●).
3. **PPD Prompts:** Represented by a gray circle (●).
* **Data Points:** Thousands of semi-transparent circular markers, colored according to the legend.
### Detailed Analysis
The data is organized into three primary clusters with distinct spatial characteristics:
1. **EFT Prompts (Red Cluster):**
* **Spatial Grounding:** Centered in the left half of the plot.
* **Trend & Distribution:** Forms a dense, roughly circular cloud. The core density is centered approximately at coordinates **(-40, 0)**. The cluster spans from about X = -60 to X = -10 and Y = -20 to Y = +20. It shows very little overlap with the other clusters, primarily touching the gray cluster on its right edge.
2. **IFT Prompts (Blue Cluster):**
* **Spatial Grounding:** Located in the bottom-right quadrant, extending towards the center-right.
* **Trend & Distribution:** Exhibits an elongated, diagonal shape. The densest region is at the bottom, centered near **(10, -30)**. The cluster extends upwards and to the right, with a secondary concentration around **(30, 0)**. It spans from approximately X = 0 to X = 45 and Y = -38 to Y = +15. It overlaps significantly with the gray cluster in the region between X=0 to X=20 and Y=-10 to Y=+10.
3. **PPD Prompts (Gray Cluster):**
* **Spatial Grounding:** Occupies the upper-central and right-central region of the plot.
* **Trend & Distribution:** This is the most dispersed and irregularly shaped cluster. It has a broad vertical spread. A major concentration is in the upper region, peaking around **(10, 25)**. Another dense area connects downwards, overlapping with the blue cluster. It spans from approximately X = -15 to X = 40 and Y = -25 to Y = +35. It acts as a bridge or overlapping region between the distinct red and blue clusters.
### Key Observations
* **Clear Separation:** The EFT (red) and IFT (blue) prompts form two distinct, well-separated clusters, suggesting fundamental differences in their underlying features.
* **The Bridging Role of PPD:** The PPD (gray) prompts are not a single tight cluster but are widely distributed, filling the space between the red and blue clusters and overlapping with both. This suggests PPD prompts may share characteristics with both EFT and IFT types or represent a more diverse category.
* **Density Variation:** The red cluster is the most compact and dense. The blue cluster is dense at its core but elongated. The gray cluster is the most diffuse.
* **Outliers:** A few isolated blue points appear within the red cluster's periphery (e.g., near (-20, 10)), and a few gray points are found deep within the blue cluster's core. These could be misclassified examples or edge cases.
### Interpretation
This scatter plot visualizes the semantic or feature-space separation between three types of prompts (EFT, IFT, PPD). The strong spatial segregation between the red (EFT) and blue (IFT) clusters indicates that these two prompt types are distinct in the analyzed feature space—they likely elicit different model behaviors or are designed for different tasks.
The gray (PPD) prompts' dispersed nature and their position overlapping both other clusters suggest they are either a more heterogeneous category, a hybrid type, or a general-purpose category that encompasses features of both EFT and IFT prompts. The plot effectively demonstrates that EFT and IFT prompts are specialized and distinct, while PPD prompts are more general and bridge the gap between them. This has implications for prompt engineering, suggesting that choosing between EFT and IFT may lead to more predictable, specialized outcomes, while PPD prompts might offer more flexibility or variability.