\n
## Heatmap: Performance Metrics for Different Categories
### Overview
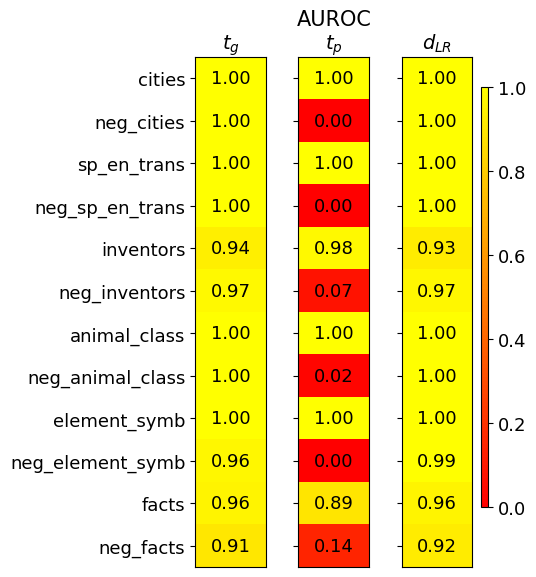
This image presents a heatmap displaying performance metrics for ten categories and their corresponding negative counterparts. The metrics are represented by color intensity, with a scale ranging from 0.0 to 1.0. The heatmap is divided into three columns, each representing a different metric: *t<sub>G</sub>*, *AUROC<sub>tp</sub>*, and *d<sub>LR</sub>*. The rows represent different categories, including both positive and negative examples.
### Components/Axes
* **Rows (Categories):** cities, neg\_cities, sp\_en\_trans, neg\_sp\_en\_trans, inventors, neg\_inventors, animal\_class, neg\_animal\_class, element\_symb, neg\_element\_symb, facts, neg\_facts.
* **Columns (Metrics):**
* *t<sub>G</sub>* (Top-left column)
* *AUROC<sub>tp</sub>* (Center column)
* *d<sub>LR</sub>* (Right column)
* **Color Scale:** Ranges from approximately 0.0 (dark red) to 1.0 (yellow). The scale is positioned on the right side of the heatmap.
* **Axis Labels:** Row labels are on the left, column labels are at the top.
* **Values:** Numerical values are displayed within each cell of the heatmap, representing the metric score for the corresponding category.
### Detailed Analysis
The heatmap displays the following values:
* **cities:** *t<sub>G</sub>* = 1.00, *AUROC<sub>tp</sub>* = 1.00, *d<sub>LR</sub>* = 1.00
* **neg\_cities:** *t<sub>G</sub>* = 1.00, *AUROC<sub>tp</sub>* = 0.00, *d<sub>LR</sub>* = 1.00
* **sp\_en\_trans:** *t<sub>G</sub>* = 1.00, *AUROC<sub>tp</sub>* = 1.00, *d<sub>LR</sub>* = 1.00
* **neg\_sp\_en\_trans:** *t<sub>G</sub>* = 1.00, *AUROC<sub>tp</sub>* = 0.00, *d<sub>LR</sub>* = 1.00
* **inventors:** *t<sub>G</sub>* = 0.94, *AUROC<sub>tp</sub>* = 0.98, *d<sub>LR</sub>* = 0.93
* **neg\_inventors:** *t<sub>G</sub>* = 0.97, *AUROC<sub>tp</sub>* = 0.07, *d<sub>LR</sub>* = 0.97
* **animal\_class:** *t<sub>G</sub>* = 1.00, *AUROC<sub>tp</sub>* = 1.00, *d<sub>LR</sub>* = 1.00
* **neg\_animal\_class:** *t<sub>G</sub>* = 1.00, *AUROC<sub>tp</sub>* = 0.02, *d<sub>LR</sub>* = 1.00
* **element\_symb:** *t<sub>G</sub>* = 1.00, *AUROC<sub>tp</sub>* = 1.00, *d<sub>LR</sub>* = 0.99
* **neg\_element\_symb:** *t<sub>G</sub>* = 0.96, *AUROC<sub>tp</sub>* = 0.00, *d<sub>LR</sub>* = 0.99
* **facts:** *t<sub>G</sub>* = 0.96, *AUROC<sub>tp</sub>* = 0.89, *d<sub>LR</sub>* = 0.96
* **neg\_facts:** *t<sub>G</sub>* = 0.91, *AUROC<sub>tp</sub>* = 0.14, *d<sub>LR</sub>* = 0.92
**Trends:**
* *t<sub>G</sub>* generally scores high (close to 1.00) across all categories, with slightly lower values for 'inventors', 'neg\_inventors', 'element\_symb', 'neg\_element\_symb', 'facts', and 'neg\_facts'.
* *AUROC<sub>tp</sub>* shows a clear pattern: positive categories (cities, sp\_en\_trans, animal\_class, element\_symb) consistently score 1.00, while their negative counterparts (neg\_cities, neg\_sp\_en\_trans, neg\_animal\_class, neg\_element\_symb) score very low (0.00 - 0.02). 'inventors' and 'facts' show intermediate values.
* *d<sub>LR</sub>* is consistently high (close to 1.00) across all categories, with slightly lower values for 'inventors' and 'facts'.
### Key Observations
* The negative examples consistently perform poorly on the *AUROC<sub>tp</sub>* metric, indicating a difficulty in distinguishing between true negatives and false positives.
* The *t<sub>G</sub>* metric is relatively stable across all categories, suggesting it is less sensitive to the specific category.
* The *d<sub>LR</sub>* metric also shows high performance across all categories.
* The most significant differences in performance are observed in the *AUROC<sub>tp</sub>* metric between positive and negative examples.
### Interpretation
This heatmap likely represents the performance of a classification model on different categories of data. The three metrics provide different insights into the model's performance:
* *t<sub>G</sub>* could represent a general threshold or confidence score.
* *AUROC<sub>tp</sub>* (Area Under the Receiver Operating Characteristic curve for true positives) measures the model's ability to correctly identify positive instances. The low scores for negative examples suggest the model struggles to avoid false positives in those categories.
* *d<sub>LR</sub>* (Likelihood Ratio) indicates the model's ability to discriminate between positive and negative instances.
The consistent high scores for *t<sub>G</sub>* and *d<sub>LR</sub>* suggest the model is generally confident and able to differentiate between classes, but the low *AUROC<sub>tp</sub>* scores for negative examples indicate a specific weakness in identifying true negatives for those categories. This could be due to imbalanced datasets, inherent ambiguity in the negative examples, or limitations in the model's ability to learn the characteristics of negative instances. Further investigation into the negative examples is warranted to understand the root cause of the poor performance. The clear separation between positive and negative categories in *AUROC<sub>tp</sub>* suggests a strong ability to identify positive instances when they are present.