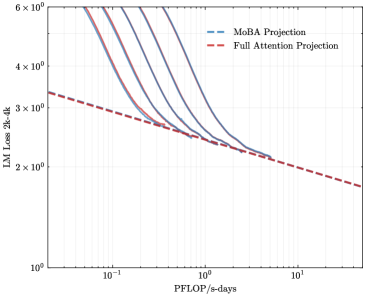
## Chart: LM Loss vs. PFLOP/s-days for MoBA and Full Attention Projections
### Overview
The image is a line chart comparing the Language Model (LM) Loss (2k-4k) against PFLOP/s-days for two different projection methods: MoBA Projection and Full Attention Projection. The chart shows how the LM Loss decreases as the computational resources (PFLOP/s-days) increase for both methods.
### Components/Axes
* **X-axis:** PFLOP/s-days (PetaFLOPS per second-days). The scale is logarithmic, ranging from approximately 0.1 to 10.
* Axis markers: 10<sup>-1</sup>, 10<sup>0</sup>, 10<sup>1</sup>
* **Y-axis:** LM Loss 2k-4k (Language Model Loss between 2000 and 4000 tokens). The scale is logarithmic, ranging from approximately 1 to 6 x 10<sup>0</sup>.
* Axis markers: 10<sup>0</sup>, 2 x 10<sup>0</sup>, 3 x 10<sup>0</sup>, 4 x 10<sup>0</sup>, 6 x 10<sup>0</sup>
* **Legend:** Located at the top-right of the chart.
* MoBA Projection (blue lines)
* Full Attention Projection (red dashed line)
### Detailed Analysis
* **MoBA Projection:** There are four blue lines representing MoBA Projection. All four lines show a decreasing trend in LM Loss as PFLOP/s-days increase.
* The top-most blue line starts at approximately (0.05, 6) and decreases to approximately (1, 2.5).
* The second blue line from the top starts at approximately (0.06, 5) and decreases to approximately (1, 2.5).
* The third blue line from the top starts at approximately (0.07, 4) and decreases to approximately (1, 2.5).
* The bottom-most blue line starts at approximately (0.08, 3.5) and decreases to approximately (1, 2.5).
* **Full Attention Projection:** The red dashed line represents Full Attention Projection. It also shows a decreasing trend in LM Loss as PFLOP/s-days increase.
* The red dashed line starts at approximately (0.05, 3.5) and decreases to approximately (10, 1.5).
### Key Observations
* The MoBA Projection lines are clustered together and show a steeper initial decrease in LM Loss compared to the Full Attention Projection line.
* The Full Attention Projection line has a more gradual decrease in LM Loss as PFLOP/s-days increase.
* At lower PFLOP/s-days values (around 0.1), the Full Attention Projection has a lower LM Loss than the MoBA Projection.
* As PFLOP/s-days increase, the LM Loss for MoBA Projection quickly converges to a similar level as the Full Attention Projection.
### Interpretation
The chart suggests that the MoBA Projection method is more efficient in reducing LM Loss at lower computational costs (PFLOP/s-days) compared to the Full Attention Projection. However, the Full Attention Projection method achieves a lower LM Loss at very low PFLOP/s-days. As the computational cost increases, the performance of the MoBA Projection converges to a similar level as the Full Attention Projection. The clustering of the MoBA Projection lines indicates some variability in performance depending on the specific configuration or parameters used. The logarithmic scales highlight the diminishing returns in LM Loss reduction as PFLOP/s-days increase for both methods.